Out-of-home remains high
Advertising Market Trend
February 2025

The Swiss advertising market closed out February 2025 with “traditional” media once again in the red. The year-on-year drop was less stark in February than it was in January, but, at CHF 255.8 gross, traditional advertising pressure was still 3.6% under the value recorded for the same month last year.
All media groups except out-of-home (+8.7%) recorded lower figures for February 2025 than for February 2024. Nevertheless, the ranking within the media mix remains unchanged: TV first, followed by print, then out-of-home, radio and cinema.
After two months, the traditional advertising market has gross advertising pressure of CHF 517.3 million, a drop of 4.8% compared to 2024.
In the digital advertising market, search has retained its lead with a share of 45.4%, despite Google’s major changes and the associated drop in advertising pressure (see the section on information about digital data). It is followed by display advertising, with 35.5%, then YouTube, with 19.1%.While the results for search and display are lower than in the previous year, YouTube continues to grow.
Information on digital data:
Search: optimization and Google’s tweaks
As mentioned in the previous newsletter, Google has updated its security processes. In February, too, this meant that search ads were harder to find. As a result, advertising pressure in January and February was lower than usual.
We expect to see valid data from March onward. Initial analyses are indicating a high level of stability, although the gross advertising volume is lower than the previous year’s figure.
YouTube – sector-specific evaluation
With the finalization of the February data, we are introducing a sector-specific evaluation of YouTube data to provide an even more precise depiction of advertising pressure. The evaluation will be adjusted retroactively to January 2024 to ensure comparability with the previous year.
Advertising pressure in the market as a whole
Advertising pressure development up to February 2025 in CHF million gross.


Retail pulls ahead
Just 7 out of 21 sectors in the traditional advertising market were able to escape the overarching downward trend. Once again, retail was the undisputed leader of the pack, recording gross advertising pressure of CHF 33.8 million, or growth of +32.0%, in February, and pulling even further ahead of subsequent contenders YTD.
The telecommunications industry also performed well, at +15.6%. Positive trends were additionally seen in the finance (+13.6%), telecommunications (+15.6%) and energy sectors, the latter once again experiencing a hefty boost of +38.4%. Digital & household (+14.9%), personal care (+40.1%) and the cleaning industry (+24.2%) once again made gains in February, compared to the same month in the previous year.
Downward trends in 14 sectors
The result for the tobacco industry is a clear reflection of the impact of the tighter advertising ban: at -84.3%, the industry is very much bringing up the rear. That said, sectors towards the top of the leaderboard are in the red, too. The chasing pack, led by food (-8.5%), leisure, gastronomy and tourism (-24.7 %) and initiatives & campaigns (-12.7%) lost ground in February, with the advertising pressure recorded by other industries, such as pharmaceuticals & health (-17.2%) and transportation (-39.6%), also sometimes dropping substantially in the second month of the year.
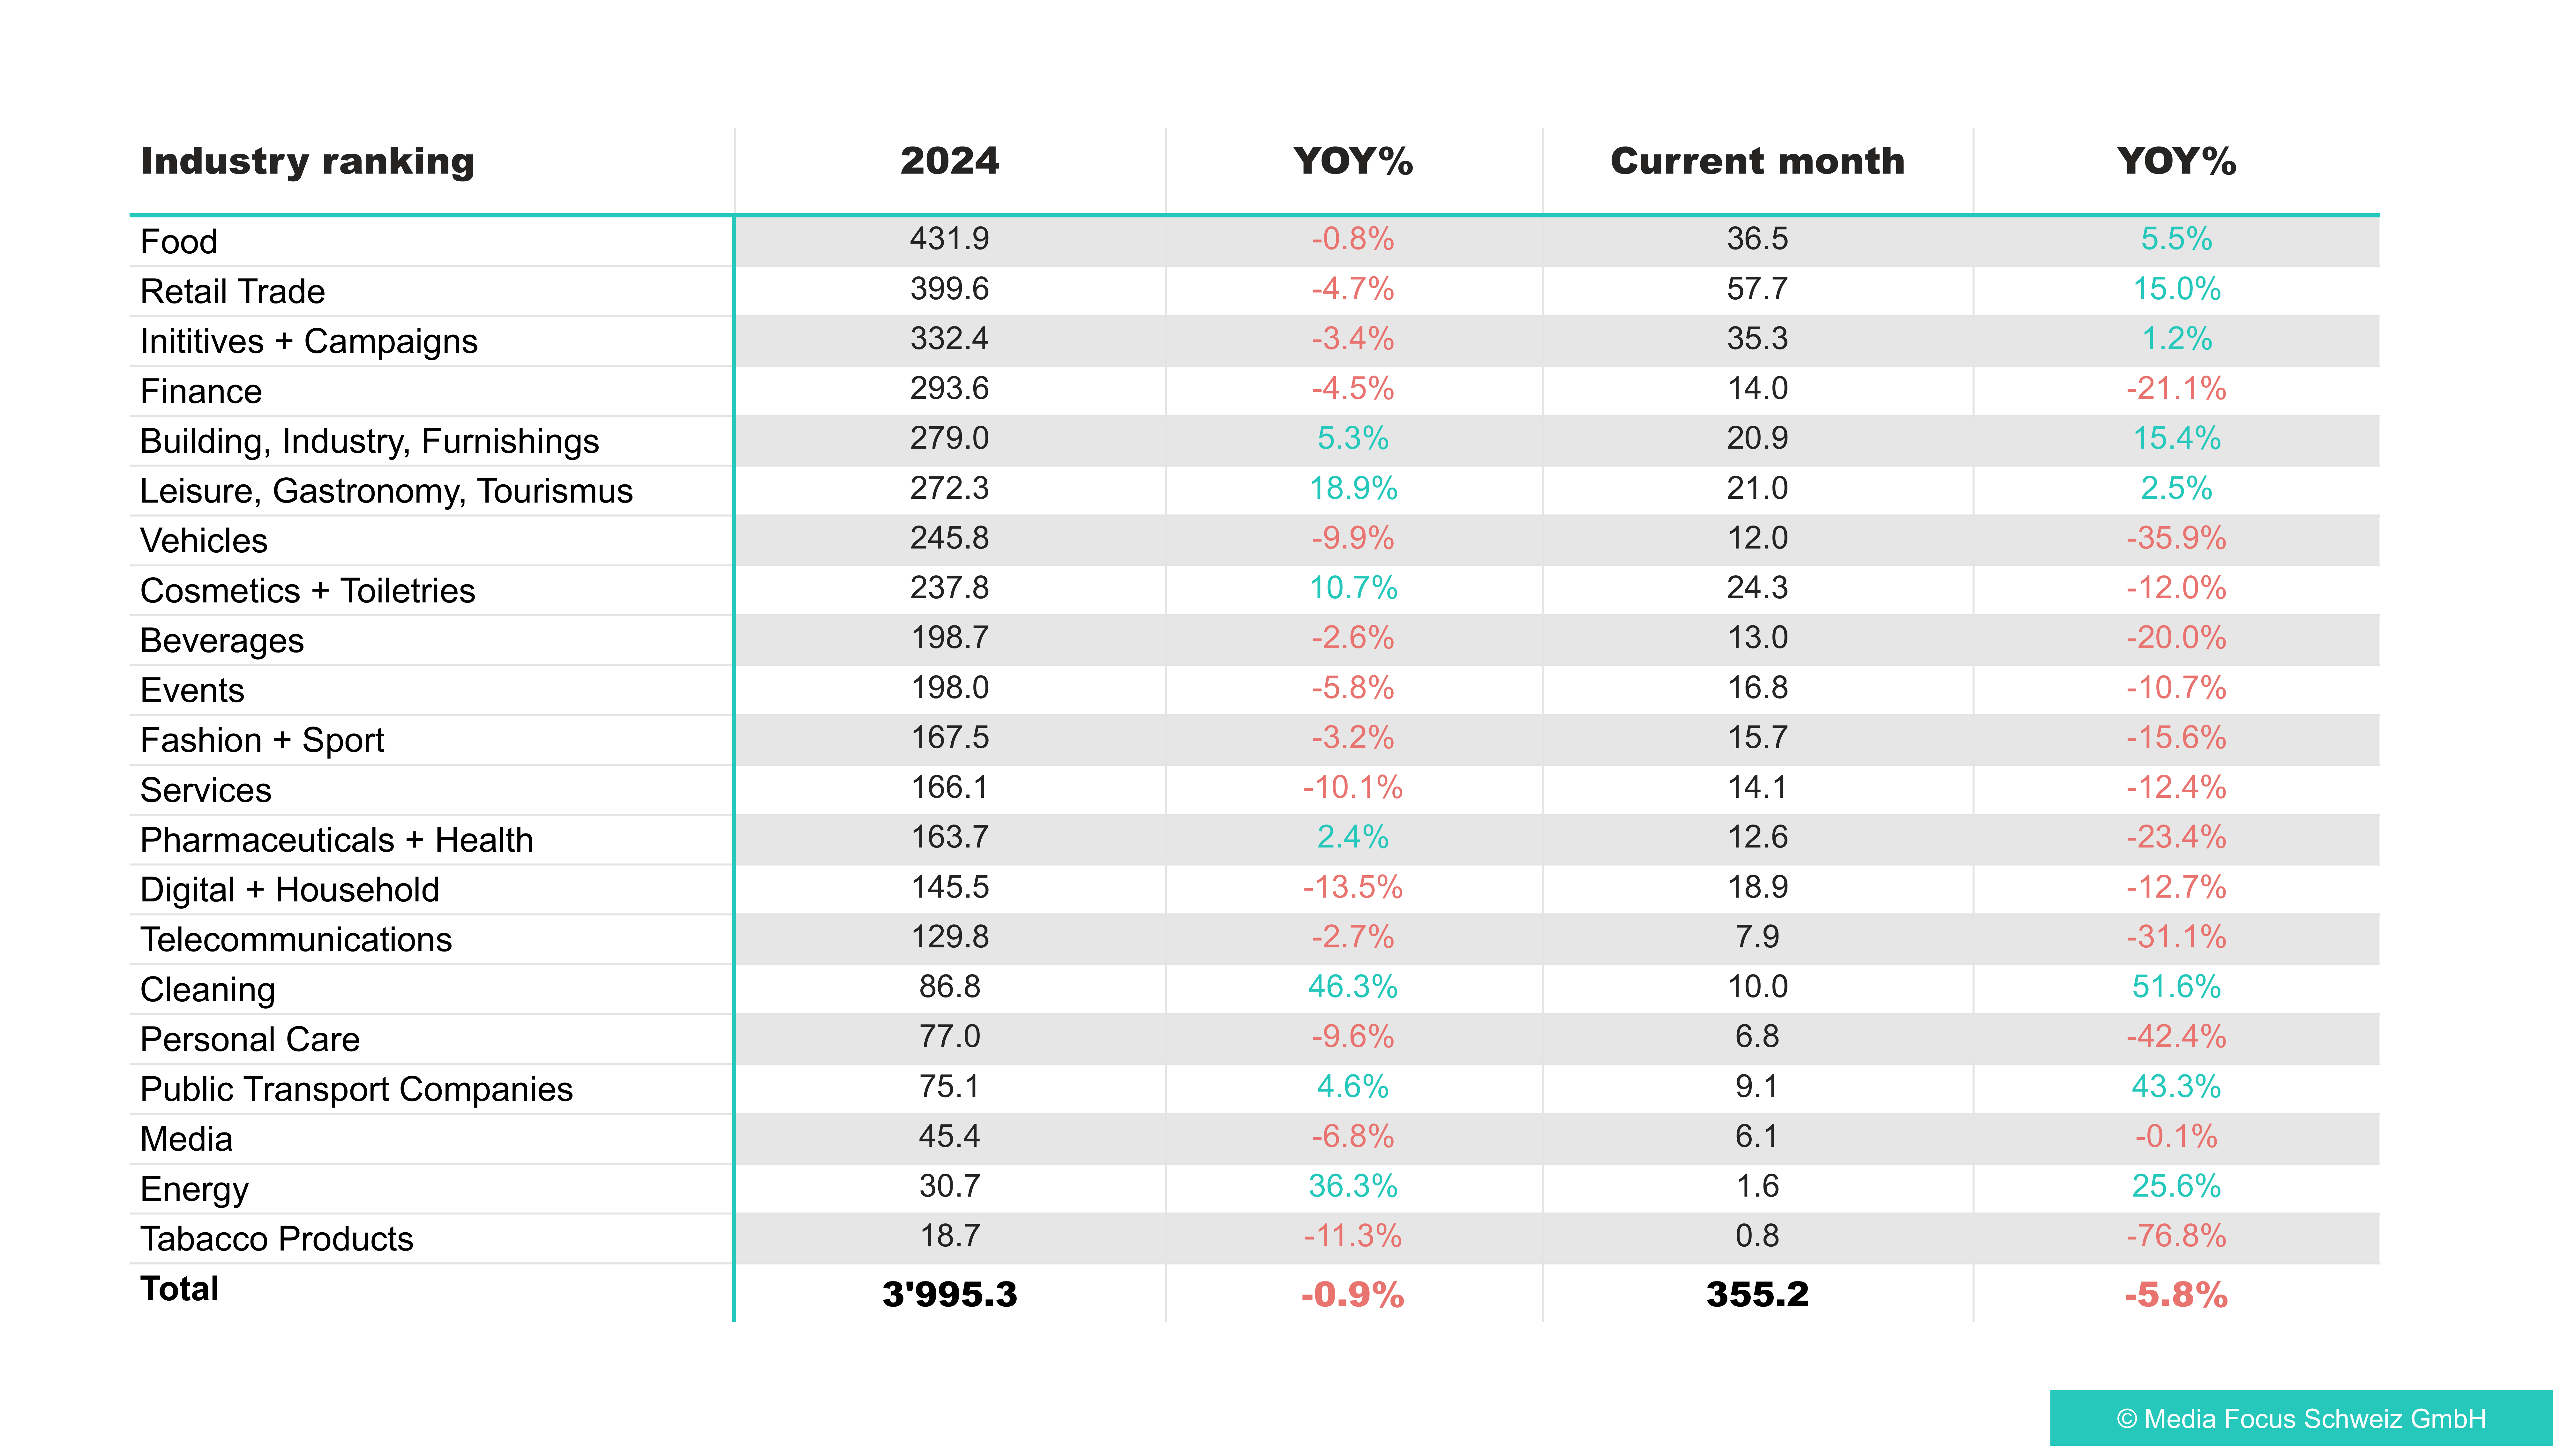
Sector ranking
Sector ranking for February.

Top advertisers and products
The top advertisers and most advertised products and services (excluding range, image and other advertising) in February.

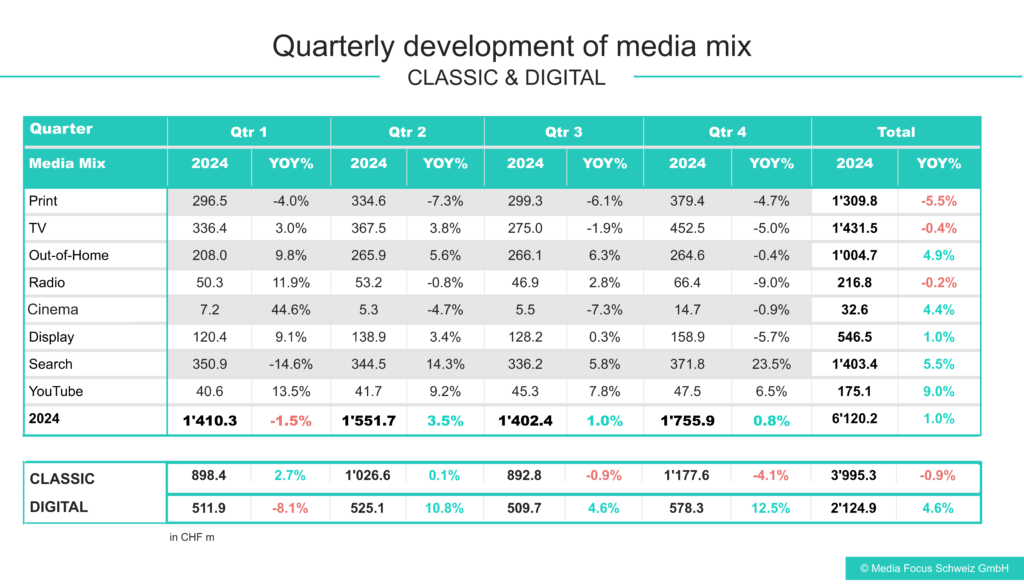
Media mix
Media mix for February.

Advertising pressure in the digital market
Development of advertising pressure up to February 2025 in CHF million gross.


Sector ranking: traditional vs. digital channels in comparison
The leisure, gastronomy and tourism sector is in pole position in the digital advertising market for the year to date (YTD), although it only recorded the second-highest gross advertising expenditure in February. These industries take third place in the traditional market. In the digital market, retail (2nd place) and finance (3rd place) are the other medalists on the podium. While retail is in the lead in the traditional market, finance, in 5th place, just manages to squeeze into the top third.
Pharmaceuticals & health, telecommunications and beverages are in the middle of the table for both channels.
The tobacco, events and cleaning sectors are languishing at the bottom of the digital market, although tobacco and cleaning are the only sectors to have made headway compared to the previous year. In the traditional market, tobacco is in last place (as mentioned above), with the energy, media and transportation sectors just ahead of it.
Sector ranking
Sector ranking for February.

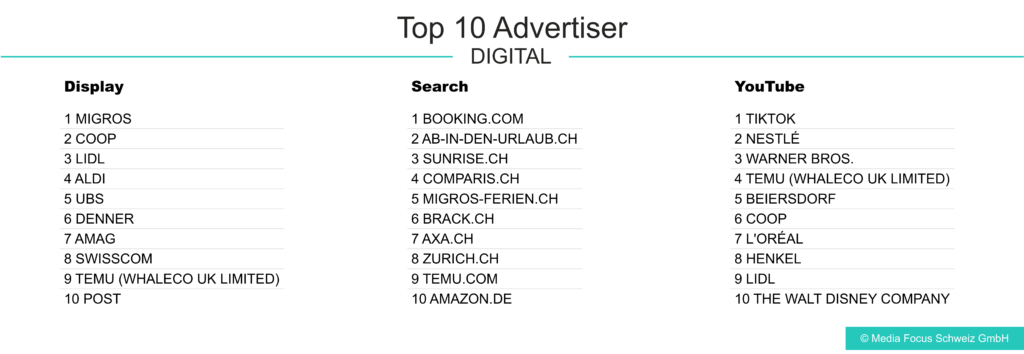
Top digital products
The most advertised products and services (excluding range, image and other advertising) in February.

The wireless carrier spusu.ch took first place in the display sector, while booking.com was top of the search rankings and the Audi A6 e-tron was at the top of the YouTube list. TUI Holidays made it into the top half of the top 10 for display, with tui.ch in the bottom half of the top 10 for search.
Media Mix
Media mix for February.

Contact: mediafocus@mediafocus.ch, Tel.: +41 43 322 27 50