
Annual review of the Swiss advertising market
by Tina Fixle, Chief Analytics Officer (CAO)

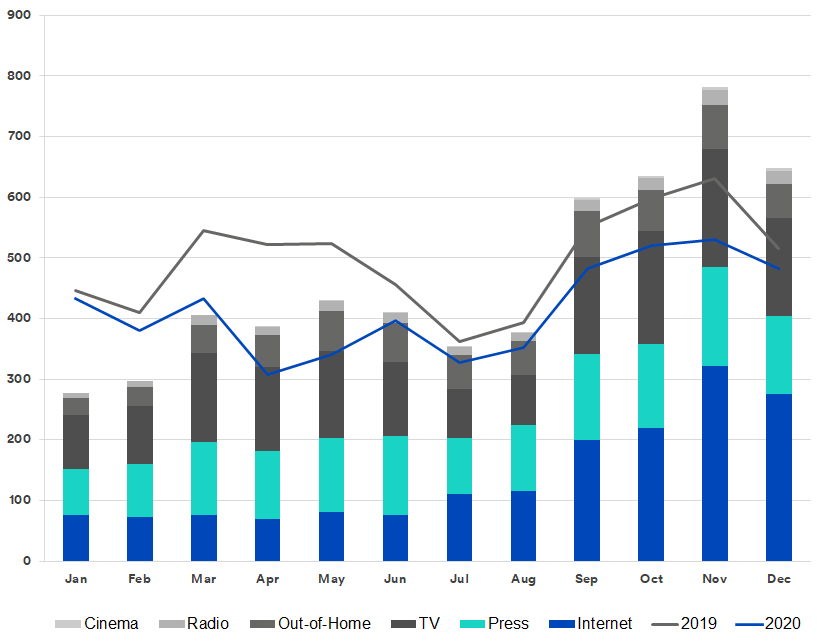
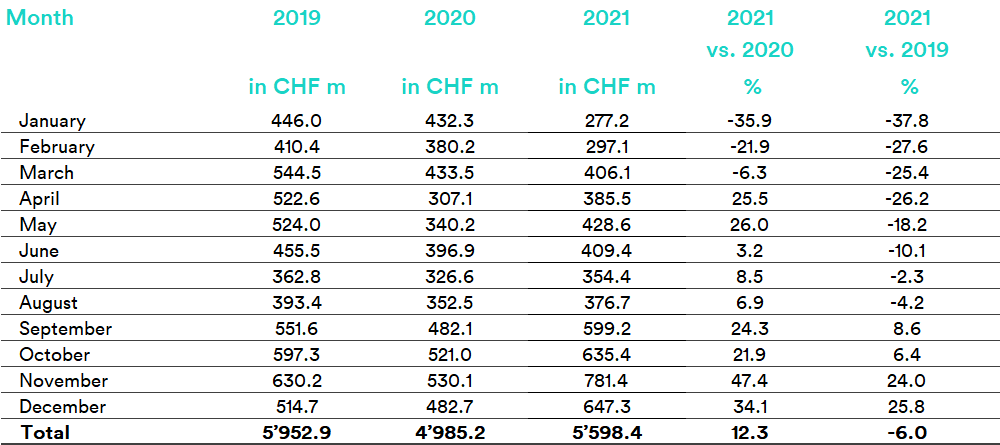
Another year dominated by the pandemic is drawing to a close. Despite lockdowns, enforced working from home, major restrictions to public life and travel, as well as widespread uncertainty and frustration, the Swiss advertising market has shown that time stands still for no one. In 2021, CHF 5,598 million of gross advertising pressure was generated in its 21 sectors. This represents an increase of 12.3% compared with 2020, or a rise of CHF 613 million. Compared with 2019, prior to the coronavirus pandemic, 2021 was just -6.0% (CHF -354.5 million) lower.
Advertising Pressure in the market as a whole
Development of Advertising Pressure 2021 in million francs (gross)
A summary of the year: subdued first quarter, strong finish
Advertisers made a restrained start to the year during the first quarter. Minus 21.3% compared with 2020 and minus 30% compared with 2019.
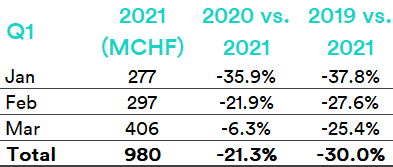
This was hardly surprising, though, as the Confederation had just agreed to extend and expand the restrictions on December 18, 2020. Closed restaurants, closed sports grounds, closed cultural and leisure facilities, restrictions to personal freedoms, restrictions to air traffic and no end in sight. Switzerland and the rest of the world remained in hibernation.
But the newly approved vaccine and new testing capabilities increased hopes of a possible end to restrictions. On February 17, 2021, the Federal Council then opted for a “cautious, gradual reopening, in order to allow greater freedoms in social and economic life again.”
The Swiss advertising market experienced a revival during the second quarter. Not yet at the pre-pandemic level (-18.5% compared to 2019), but still a significant increase compared with the previous year (+17.2%).
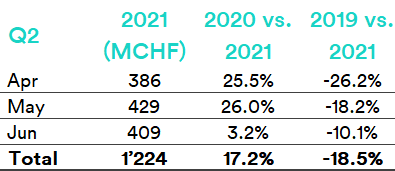
April and May stood out in particular, each with 25% more advertising pressure – unsurprisingly, as Switzerland was experiencing its first lockdown this time the previous year. In 2021, the dampening of advertising pressure in June once again heralded the arrival of the summer slowdown, but the Euros spurred on Switzerland’s TV market with pricey advertising slots and somewhat softened the blow (-4.5% May 2021 vs. June 2021; -13.1% May 2019 vs. June 2019).
2020 should be regarded as an exceptional year, as the advertising presence trajectory rose sharply again following the first lockdown in June (+16.7% May 2020 vs. June 2020).
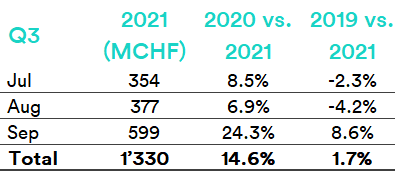
The third quarter heralded a change in the Swiss advertising market. Not only was it well above the previous year’s value (+14.6%), but thanks to a strong September (CHF 599 million, +24.3% 2020 vs. 2021, +9% 2019 vs. 2021), it also finished slightly up for the first time compared with pre-pandemic 2019 (+1.7%).
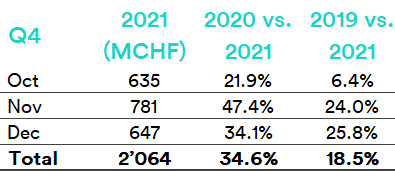
This continued into the fourth quarter. Buoyed by hopes of a return to normality and unused advertising budgets, the fourth quarter generated CHF 2,064 million of gross advertising pressure. This represents around a third of the annual advertising pressure (36.9%, 2020: 30.8%, 2019: 29.3%). Compared with the previous year, 34.6% more advertising pressure was therefore achieved (18.5% compared with 2019).
Thanks to a strong finish, the advertising year 2021 ended on a conciliatory note, raising hopes of increased normality in 2022. While COVID-19 has driven digital transformation, changing the way we live and work and forcing us to use virtual methods, it has failed to bring life to a halt as we had feared last year. People are adaptable and find creative solutions, so the Swiss advertising industry has also adapted to these new circumstances. However – and we should not ignore this – it is the digital advertising giants, namely Google in our statistics, that have emerged as winners from the crisis, taking a slightly larger slice of the advertising cake (change without search & YouTube: 2020 vs. 2021: +6.7%; 2019 vs. 2021: -10.0%).
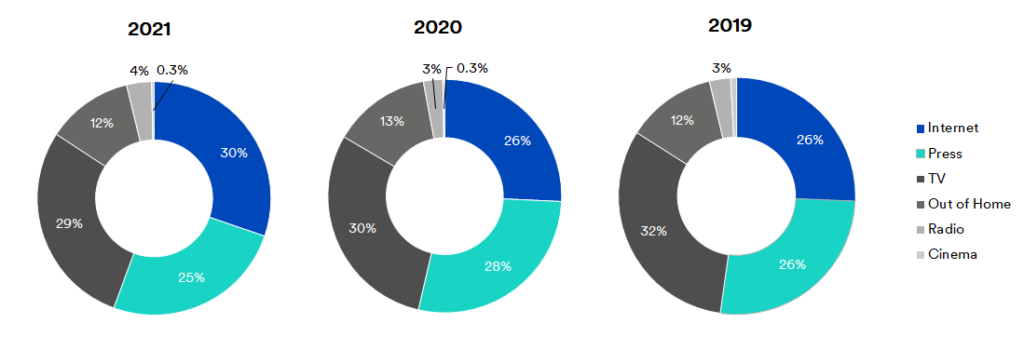
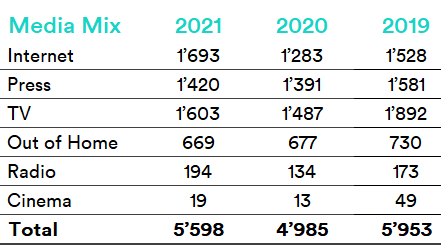
Media Mix 2019-2021
With a 30% share of the media mix in 2021, internet is now the dominant media group and thereby replaces TV. Compared with 2019 and 2020, online advertising has increased by 4 percentage points. TV advertising now accounts for 29%, print is in third place, generating a quarter of the advertising pressure, out-of-home is at 12% and radio at 4%. As in the previous year, cinema has a 0.3% market share. Prior to the pandemic, this was 0.8%.
If we look at the development of advertising pressure in the individual media groups for 2019 vs. 2021, it becomes clear that online advertising was the only one that increased (10.8%). The 12.1% rise in radio advertising can be explained by the integration of four radio stations in western Switzerland (without integration -21.3%). All other media groups remained below the 2019 level. First and foremost cinema (-61.2%), followed by TV (-15.3%), print (-10.2) and last but not least out-of-home: the media group that recorded the smallest decline during crisis-hit 2020, despite the lockdown.
Top 10 advertisers
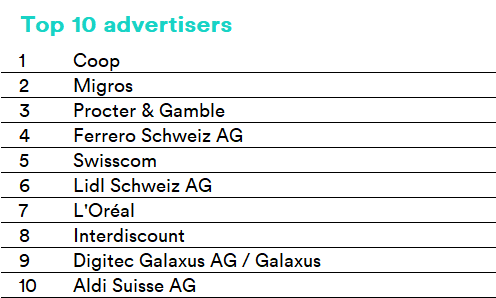
In 2021, around 27,000 advertisers were recorded in the Swiss advertising pressure statistics. 5,276 of these were new.
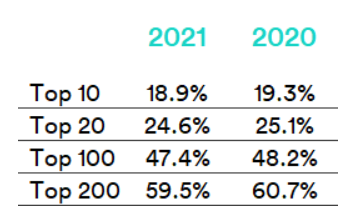
The Top 10 advertisers generated 18.9% of the advertising pressure (2020: 19.3%). The Top 20 were responsible for around 25% (2021: 24.6%, 2020: 25.1%), the Top 100 for around 50% (2021: 47.4%, 2020: 48.2%) and the Top 200 for almost 60% (2021: 59.5%, 2020: 60.7%).
There was little change in the Top 10 advertisers in 2021. Coop (1) and Migros (2) remained unchallenged in first and second place. In addition to these retail giants, Lidl (6) and Aldi (10) also made a return to the Top 10. The bronze medal once again went to the US consumer goods group Procter & Gamble (3). Ferrero (4), Swisscom (5), Lidl (6) and l’Oréal (7) occupied fourth to seventh place, as in 2020, albeit in a slightly different order. Online retailers Interdiscount and Digitec Galaxus were the only newcomers in the Top 10, coming in at eighth and nine place. Nestlé and Denner were no longer among the Top 10 advertisers.
Top 10 products
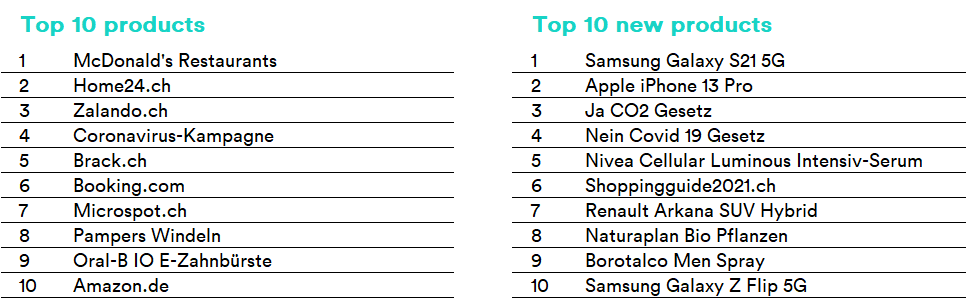
In 2021, 47,347 different products were recorded in the advertising pressure statistics, a quarter of which were advertised in Switzerland for the first time. The Samsung Galaxy S21 5G topped the list of new products, edging ahead of its competitor, the Apple iPhone 13 Pro.
The products with the highest advertising pressure in 2021 included six online shops – as far as Home24, Zalando and their competitors are concerned, every conceivable product can and should be purchased online, from suits, computers and TVs to travel offers and lemon squeezers. The Federal Office of Public Health’s coronavirus campaign only made it to fourth place in 2021. It was replaced by McDonald’s restaurants (which also do home delivery, of course). Pampers diapers in eighth place and the Oral-B IO electric toothbrush completed the Top 10 products.
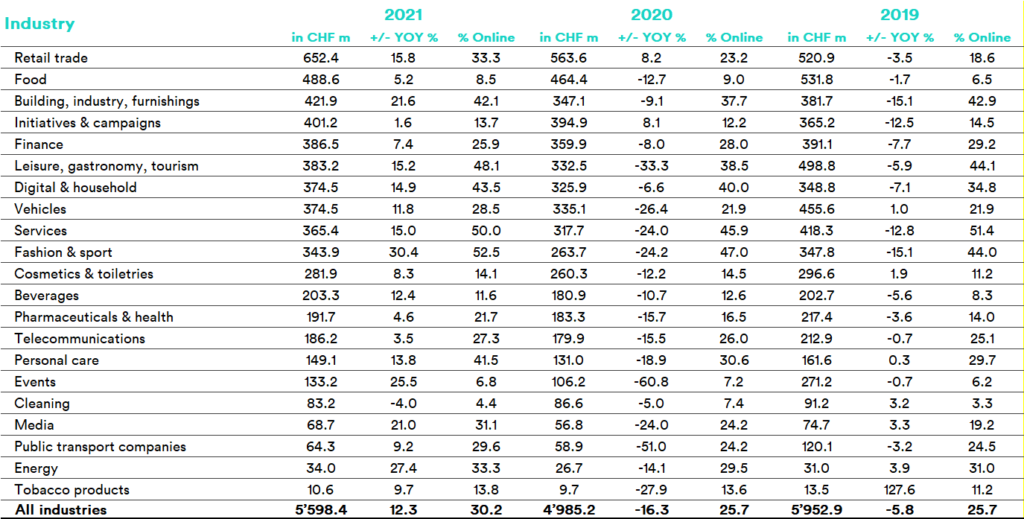
Top sectors in 2021
Only cleaning recorded a fall in advertising pressure compared with the previous year (-4.0%). It is particular interesting that this sector has the smallest share of online advertising. When compared with 2019, 15 of the 21 sectors have declined. The events sector experienced the steepest percentage decrease (−50.9%). But after falling by -60.8% from 2019 to 2020, its 2021 trajectory recovered again (+25.5%). This was the third highest increase compared to the previous year. Only fashion & sports (30.4%) and energy (+27.4) experienced stronger growth. The latter was one of the six sectors that recorded even more advertising pressure in 2021 than in 2019 (+9.5%). Retail clearly emerged as the winner from the crisis. Its advertising pressure has grown steadily from CHF 520.9 million in 2019 to CHF 563.6 million in 2020 (+8.2) and CHF 652.4 million in 2021. Building, industry, furnishings also performed strongly in 2021 (+10.5% compared with 2019, +21.6% compared with 2020) and the finance sector also breathed a sigh of relief. Following the previous year’s slump (-8.0%), it was almost back to its 2019 level (CHF 386.5 million vs. CHF 391.1 million). It was a different story for leisure, gastronomy, tourism, however, which was once again down around 25% (-23.2% 2019 vs. 2021), despite the upswing in 2021 (+15.2%). The same applied to transport, which was -46.5% down on 2019.
Total Brand Visibility & Content

Total Brand Visibility & Content
With Total Brand Visibility, Media Focus offers a product that compiles data about your media presence from advertising and reporting and then analyzes this.
Learn moreAdvertising pressure statistics
Advertising pressure statistics
Media Focus assists you by recording data about the advertising presence of your competitors and industry and analyzing advertising volume and campaign and brand strategies.
Learn moreMedia monitoring
Media monitoring
Media Focus offers every service you need for efficient media monitoring, helping you to keep track of everything and showing you how successful your communications activities have been.
Learn moreCreations
Creations
Media Focus offers the most comprehensive database of traditional and digital advertising creations in Switzerland.
Learn moreAnalysis
Analysis
We offer tailored analysis that supports you with monitoring the market and your competitors!
Learn moreSponsorship
Sponsorship
Our sponsorship analysis allows us to measure and evaluate the visibility of sponsors in the media and on the ground.
Learn more