logo logo

A subdued start to the year: only out-of-home and cinema withstood the decline in the advertising market

While 2024 started with growth, 2025 started down 6.1% in the traditional advertising market, with a gross advertising pressure of CHF 261.0 million. This decline is due to a reduction in gross advertising pressure in more than half of all sectors.

Of the traditional media groups, only out-of-home (+5.9%) and cinema (+9.9%) experienced growth compared to the previous year. All other traditional media groups saw losses, with radio suffering the biggest decline at -20.8%, followed by print (-17.3%) and TV (-2.3%). In terms of the media mix, however, TV remains the strongest media group by percentage at 35.6% (PY: 34.2%). Print and out-of-home are now equal (29.5%). However, out-of-home grew 3.3 percentage points compared to the previous year, while print dropped a full 4 percentage points in the traditional advertising market. Radio came in fourth with a share of 4.6% (PY: 5.5%). Cinema is currently at 0.6% (PY: 0.5%). If advertising from the cinema environment (foyer) were allocated to the cinema media group and not D-OOH, the share would be 0.7%. From 2025 onward, this allocation will be possible for the current year via the advertising medium dimension or the marketer dimension.

In the digital advertising market, search (69.8%) continued to come in above display (17.9%) and YouTube (12.3%). But while display and search have declined year-on-year, YouTube remained on a growth trajectory.

The data collection methodology for the search media group has been thoroughly revised in consultation with experts from media agencies. Data quality and market analysis have been improved through optimized keyword selection and a new evaluation method.

Unfortunately, Google’s latest security updates led to a temporary worldwide restriction in the tracking of search ads, which slightly reduced gross advertising pressure in the second half of January.

The decline in display is partly down to a technical update by 20 Minuten, which meant that the data for “20 Minuten Online” was not provided in time. These figures will be retroactively adjusted when the February data is finalized.


Advertising pressure in the market as a whole

Advertising pressure development up to January 2025 in CHF million gross.

Retail leads the pack while energy sees the biggest growth

The retail sector (+14.3%) is leading the current monthly rankings. Migros, Denner and Aldi have been much more active in the first month of 2025 than in the previous year, and are fueling the growth in advertising pressure in the sector. The food sector and leisure, gastronomy and tourism came in second and third respectively, but despite making the top three, these two sectors saw a decline compared to the previous year (-9.4% and -3.2%).

The energy sector experienced particularly strong growth, with the highest percentage increase of 51.1% compared to the previous year – although it remains in the bottom third of the rankings, along with personal care (+22.7%) and cleaning (+2.4%). The beverages (+27.1%), services (+12.8%) and events (+2.4%) sectors also performed positively, sitting in the middle of the pack.

Downward trends in 14 sectors

In January, 14 out of 21 sectors recorded a decline compared to the previous year. The hardest-hit sector was tobacco (-58.4%), followed by construction, industry and furnishings (-27.6%) and digital and household goods (-26.7%).

Initiatives and campaigns (-18.1%), cosmetics and toiletries (-17.3%), vehicles (-17.0%), fashion and sport (-13.6%) and public transport (-13.0%) also experienced significant decline.Media (-7.3%), telecommunications (-7.1%), finance (-6.1%), pharmaceuticals and health (-4.3%) and leisure, gastronomy and tourism (-3.2%) also showed a downward trend compared to the previous year.


Sector ranking

Sector ranking for January.

Top advertisers and products

The top advertisers and most advertised products and services (excluding range, image and other advertising) in January.

Media Mix

Media mix for January.


Advertising pressure in the digital market

Development of advertising pressure up to January 2025 in CHF million gross.

Sector ranking: traditional vs. digital channels in comparison

The finance sector led the digital advertising market, with retail coming in fourth – the exact opposite of their rankings in the traditional market. Leisure, gastronomy and tourism (second) and services (third) completed the top three in the digital market. In the traditional market, on the other hand, the food sector ranked second and leisure, gastronomy and tourism ranked third.

In both rankings, the construction, industry and furnishings sector remained in the top third. On the other end of the scale, the tobacco sector came in last place in both markets. Media and energy both sit in the bottom third, while telecommunications and pharmaceuticals and health sit in the middle of both advertising markets.

Sector ranking

Sector ranking for January.

Top digital products

The most advertised products and services (excluding range, image and other advertising) in January.

In the display sector, Active Fitness took first place, while booking.com was top of the search rankings and Chinese low-price retail giant Temu.com was at the top of the YouTube list. No product or service managed to break into the top 10 for more than one channel.

Media Mix

Media mix for January.

Contact: mediafocus@mediafocus.ch, Tel.: +41 43 322 27 50

Switzerland Brand Trends 2024

Media Focus veröffentlicht den Brutto-Gesamtwert der Sichtbarkeit von Werbung und Kommunikation für 320 Marken sowie spannende “Battles of the Brands” für das Jahr 2024.

Gesamtsichtbarkeit 8.8 Mrd.: ⌀ 27.6 Mio. pro Brand

Die Gesamtsichtbarkeit der 320 erfassten Brands betrug im Jahr 2024 8.8 Milliarden Bruttofranken.

Paid-Earned-Ratio zugunsten von Earned-Media

65% der Gesamtsichtbarkeit entfällt auf Earned-Media, was 5.7 Mrd. Franken entspricht. Dem gegenüber stehen 3.1 Mrd. Franken Bruttowerbedruck (35%).

Sichtbarkeitseinbusse von H1 2024 auf H2 2024

Die Gesamtsichtbarkeit ist sowohl im Vorjahresvergleich als auch im Halbjahresvergleich gesunken. 2023 vs. 2024 um -7.97% und H1 2024 vs. H2 2024 um -3.04%. Wobei es im Halbjahresvergleich 2024 in der Paid-Präsenz zu einem Anstieg um 9.05% und in der Earned-Präsenz um einen Rückgang um -9.04% kam. Prozentual den höchsten Sichtbarkeitsanstieg im Halbjahresvergleich hat die Branche Tabak (+31%), gefolgt von der Branche Persönlicher Bedarf (+24%). Hingegen verbucht die Branche Finanzinstitute die höchsten Sichtbarkeitseinbussen (-17%) gefolgt von der Branche Uhren & Schmuck (-14%).

Die gesamte Auswertung inkl. spannenden «Battles of the Brands» finden Sie in unserem Markentrend 2024.

Jetzt herunterladen!

Switzerland Brand Trends
H1 2024

Media Focus publishes total gross advertising and communications visibility for over 300 brands, as well as exciting “Battles of the Brands” for H1 2024.

Total brand visibility 4.5 billion: ⌀ 14.0 million per brand

The total brand visibility of the 320 recorded brands amounted to CHF 4.5 billion gross in the first half of 2024.

Paid-earned ratio in favor of earned media

Earned media accounts for 67% of total visibility, which corresponds to CHF 3.0 billion. This contrasts with CHF 1.5 billion in gross advertising pressure (33%).

Reduction in visibility from H1 2023 to H1 2024

Overall visibility fell by -6.7% in the first half of 2024 compared to the first six months of 2023. There was a decline in both paid presence        (-8.4%) and earned presence (-5.8%). This is mainly due to the UBS/CS merger in 2023 and its media discussion. In percentage terms, the highest increase in visibility was in the Leisure, gastronomy, tourism sector (+51%), followed by the Optics & Acoustics sector (+34%). In contrast, the Wholesale distributors sector recorded the highest decrease in visibility (-67%), followed by the Tobacco sector (-49%).

You can find the entire evaluation including exciting “Battles of the Brands” in our Brand Trend H1 2024.

Download now!

Brand Trends H1 2024

Switzerland Brand Trends
2023

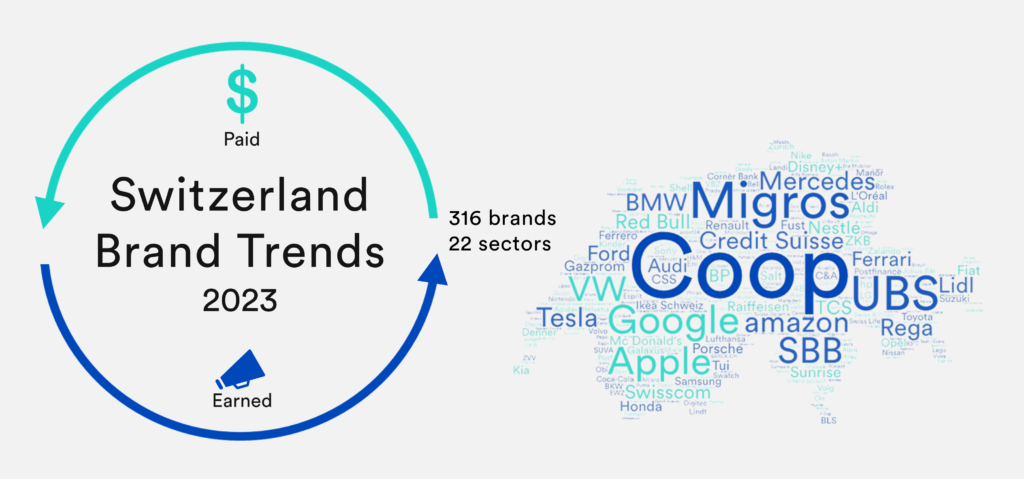
Media Focus publishes total gross advertising and communications visibility for over 300 brands, as well as exciting “Battles of the Brands” for 2023.

Total brand visibility 9.6 billion: ⌀ 30.3 million per brand

The total visibility of the 316 recorded brands amounted to 9.6 billion gross francs in 2023.

Paid-earned ratio in favor of earned media

Earned media accounts for 65% of total brand visibility, which corresponds to CHF 6.3 billion. This contrasts with CHF 3.3 billion in gross advertising pressure (35%).

Visibility almost unchanged in H1 2023 and H2 2023

Overall visibility is practically identical in H2 2023 compared to H1 2023 (-0.12%). The decline in earned presence (-3.3%) is offset by the increase in paid presence (+6.2%). The biggest driver for the decline in earned presence was the flattening of the media discussion about the UBS/CS merger. In percentage terms, the highest increase in visibility was recorded by the Cleaning sector (+89%), followed by the Personal Needs sector (+48%). On the other hand, the Financial Institutions sector recorded the biggest drop in visibility (-26%).

You can find the entire evaluation including exciting “Battles of the Brands” in our Brand Trend 2023.

Download now!

Brand Trends 2023

Switzerland Brand Trends
H1 2023

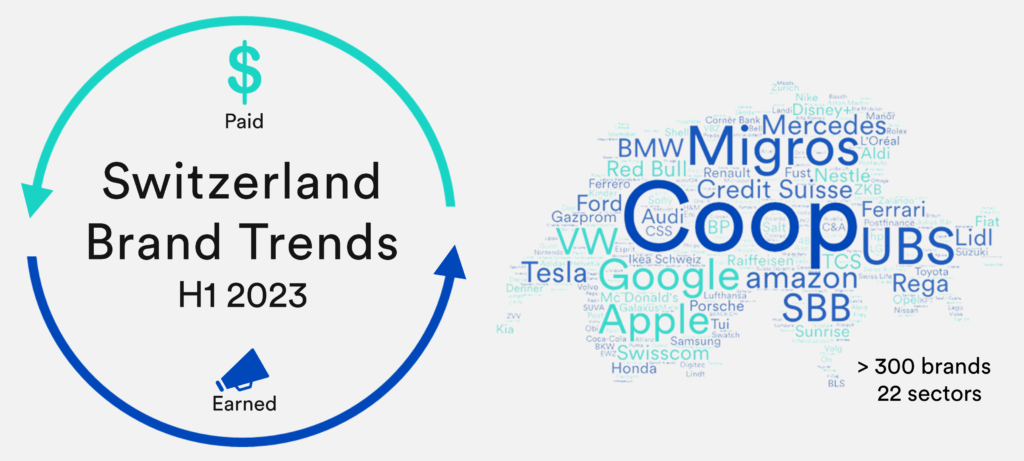
Media Focus publishes total gross advertising and communications visibility for over 300 brands, as well as exciting “Battles of the Brands” for the first half of 2023.

Total visibility 4.9 billion: avg. 15.4 million per brand

The total visibility of the 315 brands recorded amounted to CHF 4.9 billion gross in the first six months of 2023.

Paid/earned ratio in favor of earned media

65% of total visibility is apportioned to earned media, corresponding to CHF 3.2 billion. Conversely, gross advertising pressure (35%) amounted to CHF 1.7 billion.

Visibility increase from H1 2022 to H1 2023

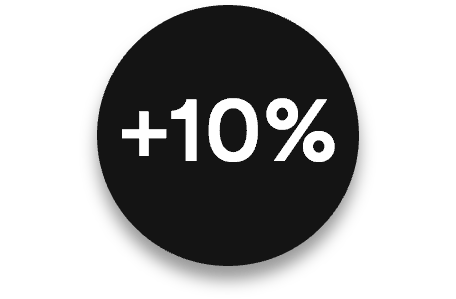
In the first half of 2023, total visibility increased by CHF 457.7 million (+10%) in comparison to the first half of 2022. The decisive factor in this is the increase in earned presence (+18%). Meanwhile, paid presence fell slightly (-2%). In terms of percentage, the highest increase in visibility (+88%) comes in the financial institutions sector (CS/UBS merger). On the other end, the energy sector has seen the largest drop in visibility (-31%).

You can find the entire evaluation including exciting “Battles of the Brands” from 7 industries in our Brand Trend H1 2023.

Download now!

Brand Trends H1 2023

Switzerland Brand Trends
2022

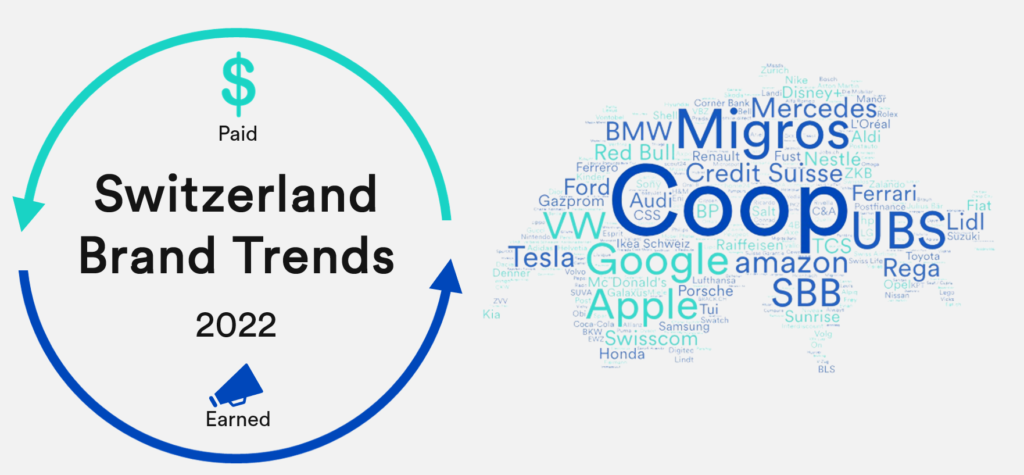
Media Focus publishes the gross value of total advertising & communication visibility for brands,
as well as an overview of the “Battles of the Brands” for 2022.

Total visibility 9.2 billion: Avg. 29.3 million per brand

The total visibility of the 315 brands recorded amounted to CHF 9.2 billion gross in 2022.

Paid/earned ratio in favor of earned media

60% of total visibility, corresponding to CHF 5.5 billion, is due to earned media. Conversely, gross advertising pressure (40%) amounted to CHF 3.7 billion.

Increase in visibility from H1 to H2

In the second half of 2022, total visibility increased by CHF 404.3 million (+9%). Paid presence (+17%) was the largest trigger behind this, but earned also saw an uptick of 4 percent.  The sector with the largest percentage growth was insurance (+48%), followed by fashion & sport (+31%) and energy (+28%). Visibility reduced for three sectors: optics & acoustics (-12%), pharmaceuticals & health (-9%) and telecommunications (-6%).

You can find the entire evaluation including exciting “Battles of the Brands” from 7 industries in our Brand Trend 2022.

Download now!

Brand Trends 2022

Brand Trend Switzerland
H1 2022

Brand Trends for the first half of 2022 shows that Coop is the most visible brand in Switzerland, thanks to its advertising presence, while media presence makes “automotive” the most visible sector. Plus, well-known brands go head-to-head in the “Battles of the Brands”.

The Brand Trends publication for the first half of 2022 from Media Focus Switzerland analyzes the advertising and media presence of more than 300 brands across 22 sectors in Switzerland.
 
Total visibility in the first six months of 2022 amounted to CHF 4.4 billion, all told, with CHF 1.7 billion generated via paid media and CHF 2.7 billion via earned media. The relationship between advertising and communications/PR (paid/earned ratio) sits at 39:61 percent.

Thanks to its advertising presence, Coop beats out Migros as the most visible brand in Switzerland, followed by tech heavyweights Google and Apple in places 3 and 4. The automotive sector remains the most visible industry, due to its substantial media presence.

Plus, the publication encompasses exciting “Battles of the Brands” from various sectors, including the following fields. Which is the most visible brand, both overall and in individual communications channels? Toyota or Tesla? Aldi or Lidl? Rolex or Omega?
 
Tina Fixle, CAO at Media Focus: “Marketing and communications are key drivers of brand visibility. That’s why our Brand Trends publication brings together data on advertising and media presence to generate a holistic view of brand visibility, in terms of communications, within the Swiss market. Holistically evaluating brand presence enables comparisons to be made.”

Brand Trend 2020

A small step “data linkage” – a big step for “brand management” and “communication research” in Switzerland!
The Brand Trend Switzerland, the most comprehensive publication on overall communicative visibility in the Swiss brand landscape, is here!
Which brands had the highest visibility in the first half of 2020, which had the highest virality? Who was most visible in print advertising? Who was reported on the most in online news and social media? The brand trend provides answers to these and many other questions.
In addition, you can expect three exciting “Battles of the Brands” and the “Twin Analysis” with strategic twins of ZKB.
The holistic evaluation of brand presence creates unique opportunities for comparison. Find out more now.

Brand Trend 2019

Ein kleiner Schritt „Datenverknüpfung” – ein grosser Schritt für „Markenführung” und A small step “data linkage” – a big step for “brand management” and “communication research” in Switzerland!
The Brand Trend Switzerland, the most comprehensive publication on overall communicative visibility in the Swiss brand landscape, is here!
Which brands had the highest visibility in 2019, which had the highest virality? Who was most visible in print advertising? Who was reported on the most in online news and social media? Brand Trends provides answers to these questions and many more.
In addition, you can expect three exciting “Battles of the Brands” and the “Twin Analysis” with strategic twins from grocery discounter Denner.

Brand Trend 2018

A small step “data linkage” – a big step for “brand management” and “communication research” in Switzerland!
In addition to Total Industry Visibility, you can expect three exciting “Battles of the Brands” and the “Twin Analysis” with strategic twins of SBB.
The holistic evaluation of brand presence creates unprecedented opportunities for comparison. Find out more now.