
Highlights in July
by Alicia Görlitz

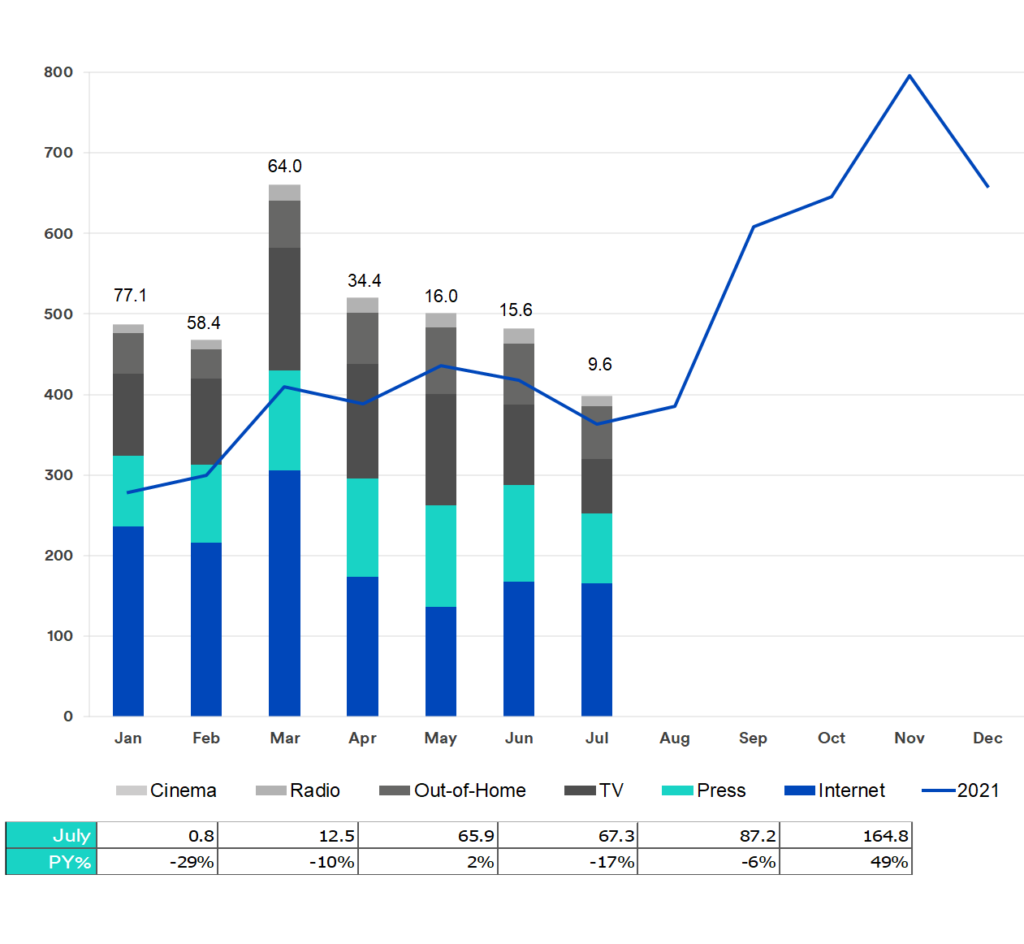
At a gross value of CHF 398.5 million, the advertising month of July has closed out 9.6 percent above the previous year’s figure –
the lowest percentage increase of the year thus far. This is hardly surprising, as the Olympic Games gave the advertising market an additional boost during this period last year.
As in previous years, the summer slump has also impacted advertising pressure, which dropped by 17.4% compared to the previous month, June.
The tobacco (-80.9%), telecommunications (-54.9%) and automotive (-38.0%) sectors similarly displayed less advertising pressure than in June. Energy was the only sector to record a major uptick, at 9.2%.
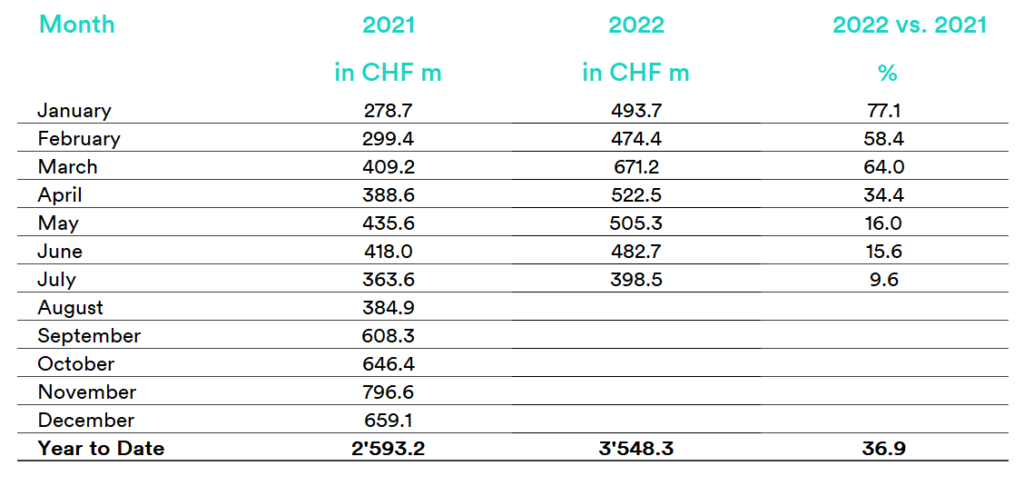
From January to July 2022, total gross advertising pressure amounted to CHF 3,550 million, up 36.9% on the same period in the previous year.
Advertising Pressure in the market as a whole
Development of Advertising Pressure as per July 2022 in million francs (gross)
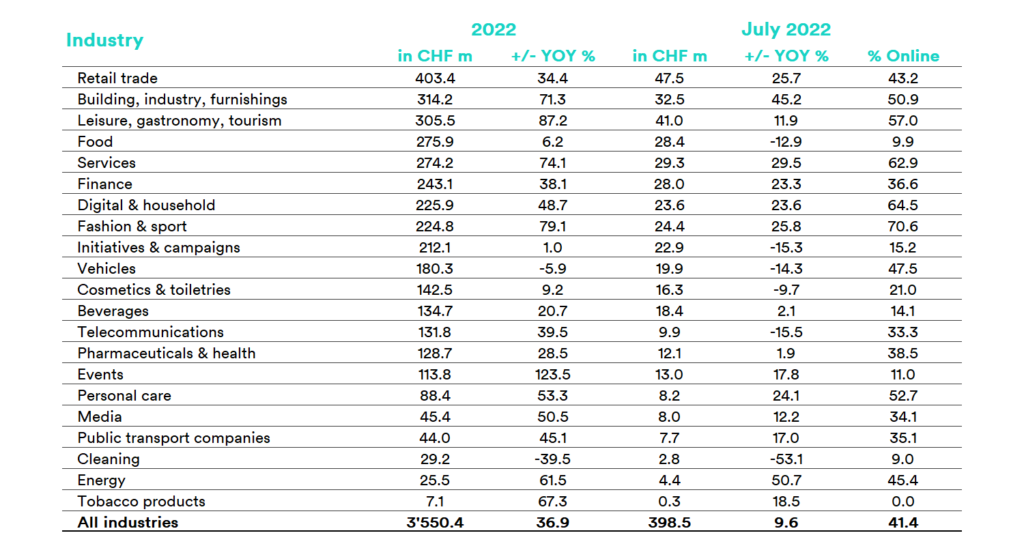
Retail continues to see the highest advertising pressure
Fifteen out of twenty-one sectors saw higher advertising pressure in July than in the same month in the previous year, with the energy sector experiencing the biggest rise (+50.7%). Construction, industry and furnishings (+45.2%) saw the second-highest percentage increase, putting this sector in second place in the overall annual ranking, behind retail (+25.7%). Leisure, gastronomy and tourism took third place, with the sector’s advertising pressure increasing by 11.9% in July.
These three sectors kept their advertising pressure at high levels, putting them even further ahead of the rest of the advertising market.
Six sectors with less advertising pressure compared to last year
Six sectors saw less advertising pressure compared to July last year. The most marked dip was in the cleaning sector (-50.7%).
The food sector also experienced a further drop in advertising pressure in July (-12.9%). Initiatives and campaigns (-15.3%), automotive (-14.3%), cosmetics and toiletries (-9.7%) and telecommunications (-15.5%) were in the same boat.
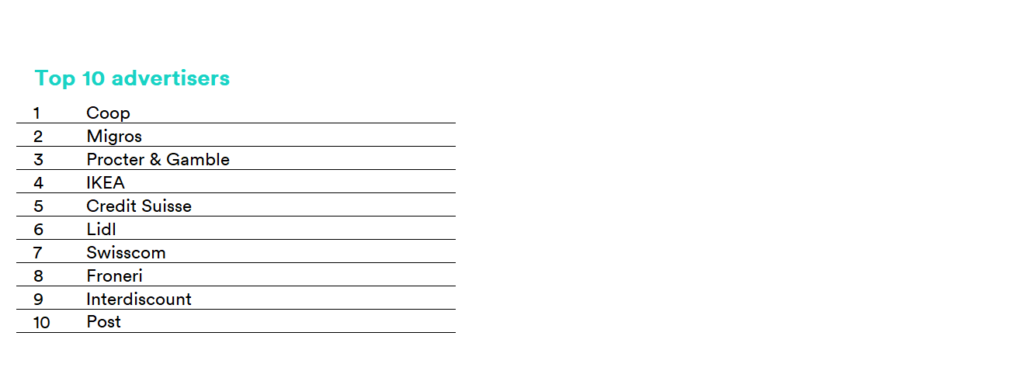
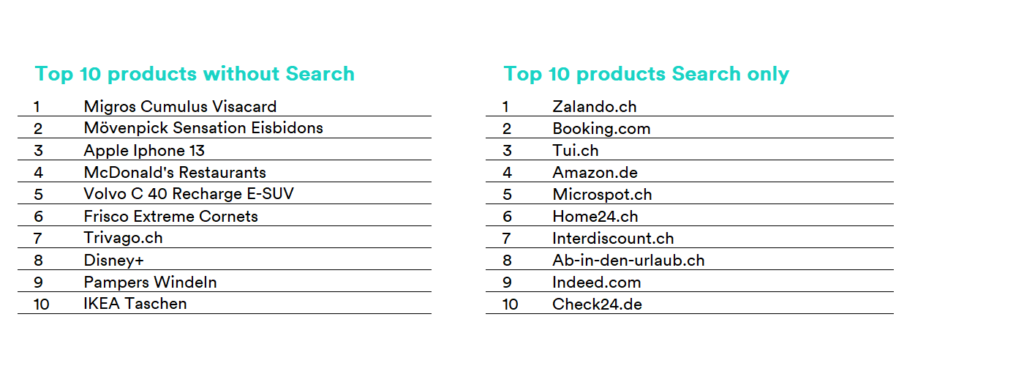
Top of the month
The top advertisers and most widely advertised products and services (excluding range, image and collective categories) in July
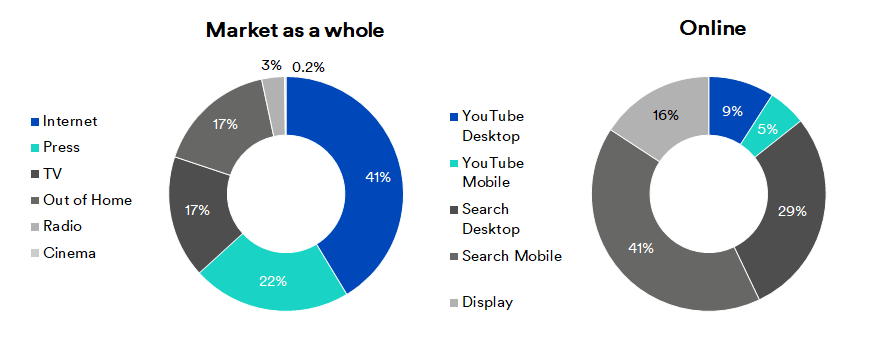
Media Mix
Media Mix for the month of July
Total Brand Visibility & Content

Total Brand Visibility & Content
With Total Brand Visibility, Media Focus offers a product that compiles data about your media presence from advertising and reporting and then analyzes this.
Learn moreAdvertising pressure statistics
Advertising pressure statistics
Media Focus assists you by recording data about the advertising presence of your competitors and industry and analyzing advertising volume and campaign and brand strategies.
Learn moreMedia monitoring
Media monitoring
Media Focus offers every service you need for efficient media monitoring, helping you to keep track of everything and showing you how successful your communications activities have been.
Learn moreCreations
Creations
Media Focus offers the most comprehensive database of traditional and digital advertising creations in Switzerland.
Learn moreAnalysis
Analysis
We offer tailored analysis that supports you with monitoring the market and your competitors!
Learn moreSponsorship
Sponsorship
Our sponsorship analysis allows us to measure and evaluate the visibility of sponsors in the media and on the ground.
Learn more