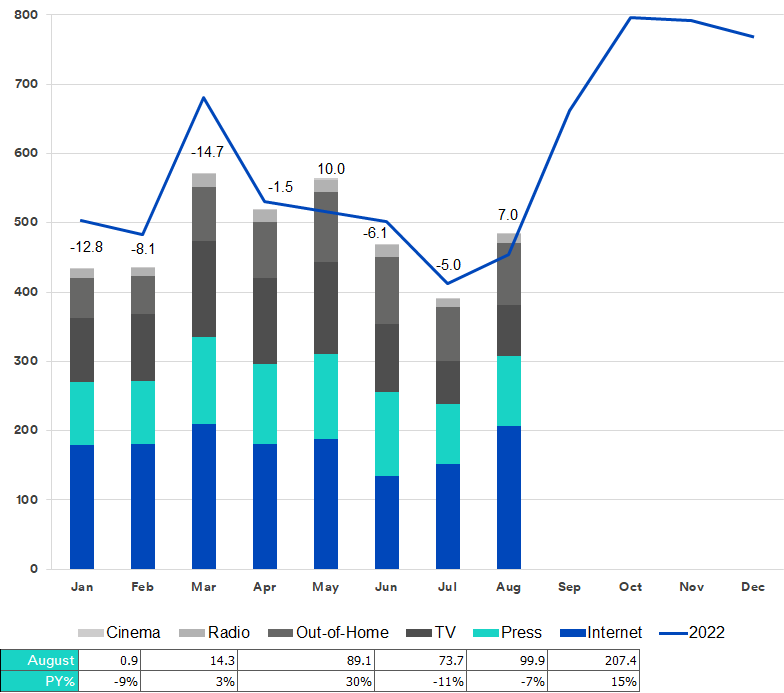
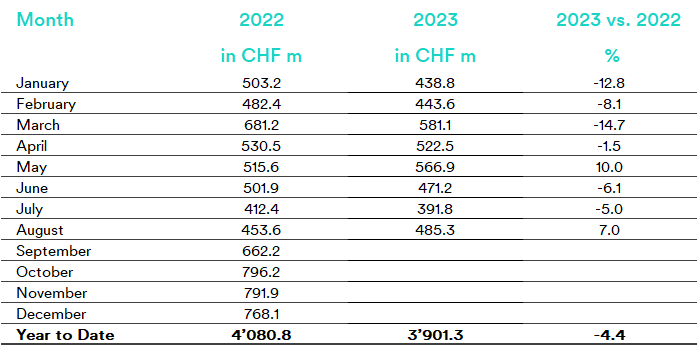
After falls in June and July, the advertising market enjoyed an upswing in August 2023 with an increase of 7 percent, closing with CHF 485.3 million gross.
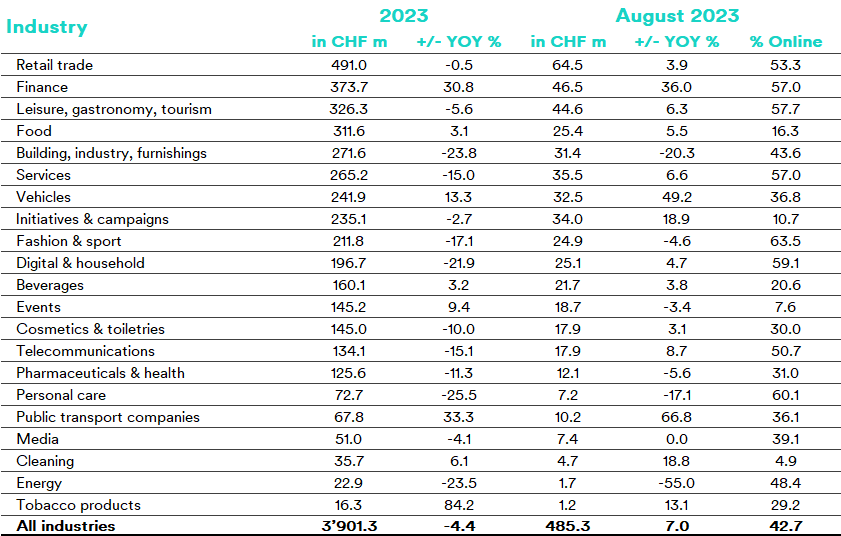
A closer look at the various sectors shows that the finance sector, public transport companies and the automotive industry enjoyed positive growth. In contrast, the energy sector, construction, industry & furnishings and personal care experienced double-digit percentage declines. Overall, 15 sectors increased their advertising pressure, while six sectors had lower figures than in the previous year.
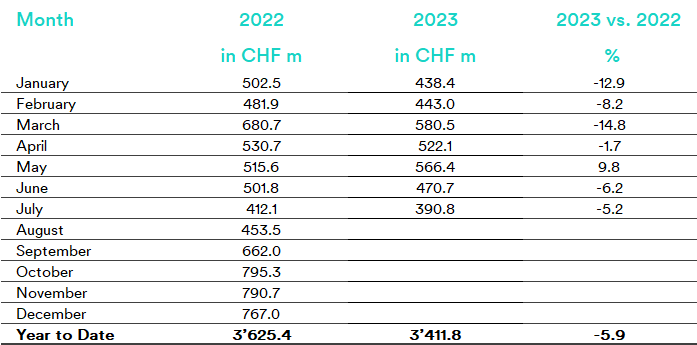
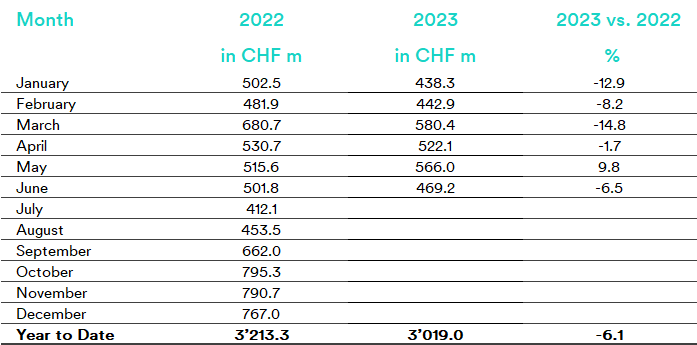
The cumulative advertising pressure (YTD) for 2023 is just under the 4 billion mark at CHF 3,901 million gross and is therefore 4.4% behind the previous year.
Advertising pressure in the market as a whole
Advertising pressure development up to August 2023 in CHF million gross
Public transport, finance and automotive experience strong growth
The finance sector once again enjoyed significant growth of 36.0 percent in August compared to the same month in the previous year, and has also been strong YTD (+30.8 percent). This is reflected in the advertising pressure of CHF 46.5 million gross in August 2023.
The rise for public transport companies is even greater – they recorded impressive growth of 66.8 percent and have increased advertising pressure by a third YTD. Public transport companies’ gross expenditure in August 2023 was CHF 10.2 million.
The automotive sector experienced growth of 49.2 percent in August and had two products (the VW ID.3 electric car and Škoda Enyaq Sportline electric SUV leasing) in the top 10.
Significant fall in the energy sector
On the other hand, however, there were sectors that recorded a significant fall in August.
The energy sector experienced a drastic decline of 55.0 percent. The construction, industry & furnishings sector also fell in August (-20.3%). Both sectors are also significantly behind YTD.
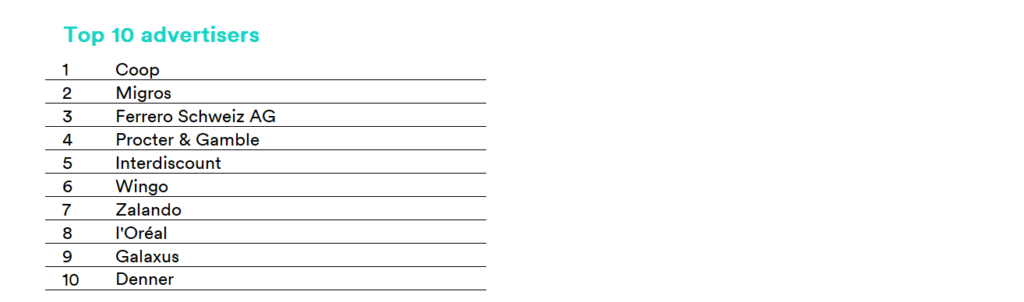
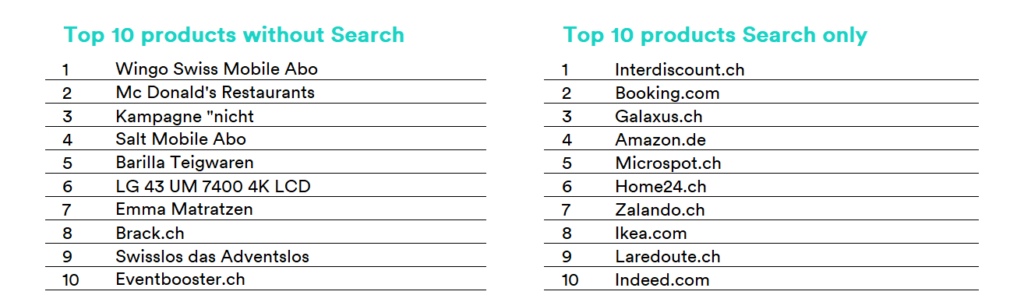
Top advertisers and products
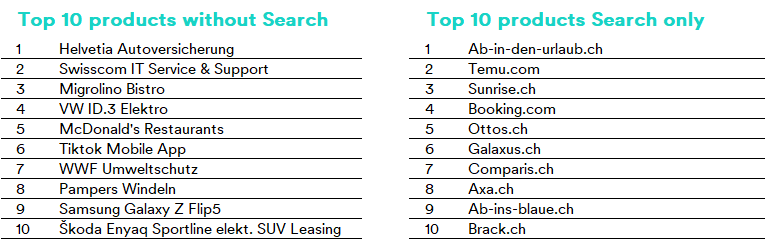
The top advertisers and most advertised products and services (excluding range, image and other advertising) in August
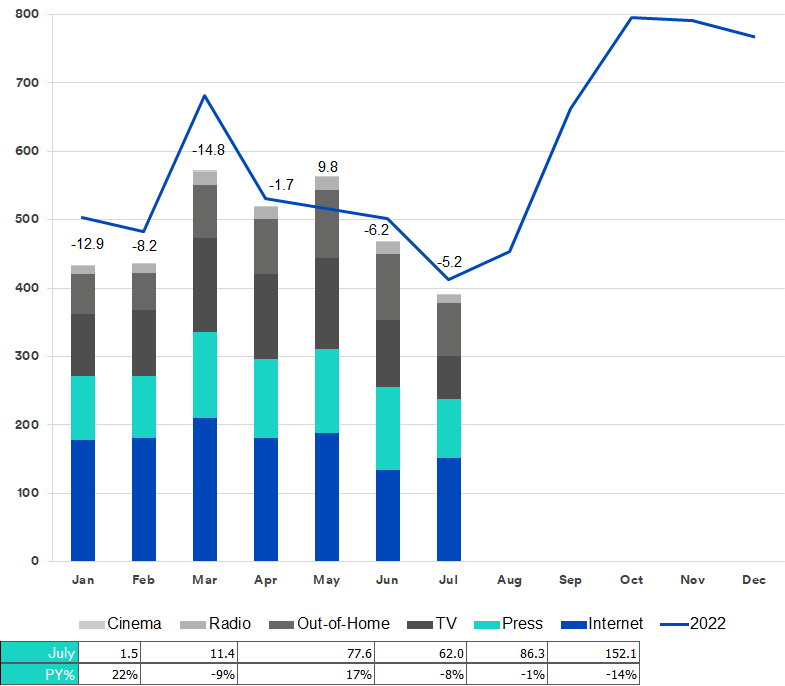
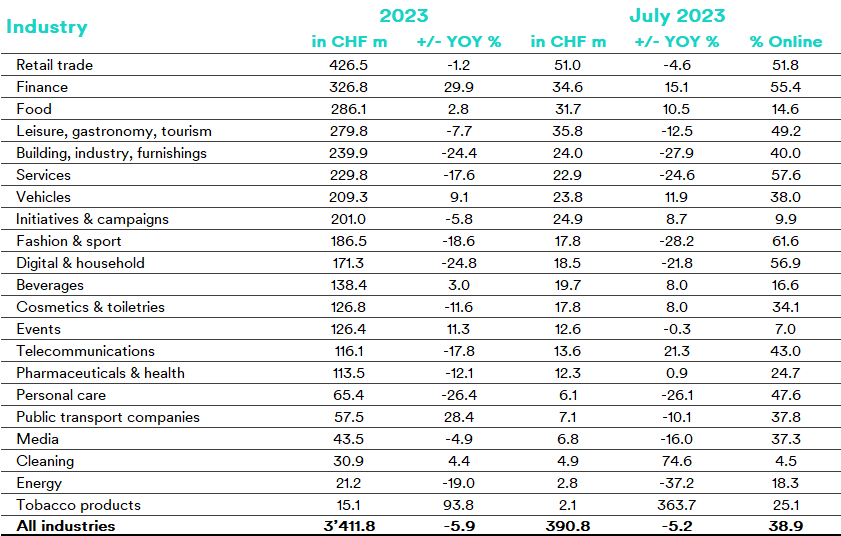
Gross advertising pressure reached 390.8 million gross in July, a reduction of 5.2 percent compared to the previous year. As in previous years, the summer slump will also be palpable in 2023. However, cinema and out-of-home seemed to buck the summer slump trend in July and increased their advertising pressure in the double-digit range.
YTD advertising pressure was 5.9 percent below the previous year’s figure, with a gross volume of CHF 3,412 million.
Advertising pressure in the market as a whole
Advertising pressure development up to July 2023 in CHF million gross
Financial sector well above 2022
The sector ranking remained almost unchanged in July. Only cosmetics & body care and events changed places.
The financial industry performed remarkably well YTD, generating almost a third more advertising pressure in 2023. While it came in sixth in the same period in 2022, it now moves up to second place. However, in July it only registered the fourth largest increase (+15.1%). Tobacco (+363.7%), cleaning (+74.6%) and telecommunications (+21.3%) achieved even more significant increases in July.
Summer slump in 12 sectors more pronounced than in 2022
The lower advertising spend in the summer is clearly palpable in 12 of the 21 sectors. As in June, the energy sector (-37.2%), fashion and sport (-28.2%) and construction, industry and furnishings (-27.9%) recorded the strongest reductions. These three sectors achieved significant increases in July of the previous year.
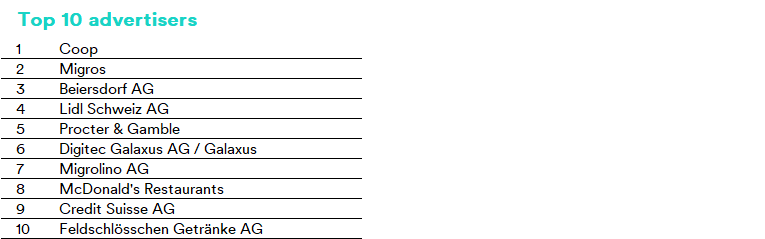
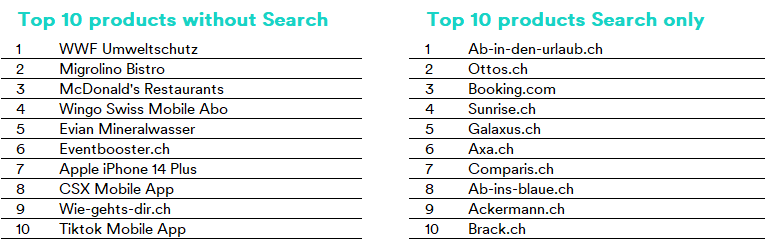
Top advertisers and products
The top advertisers and most advertised products and services (excluding range, image and other advertising) in July
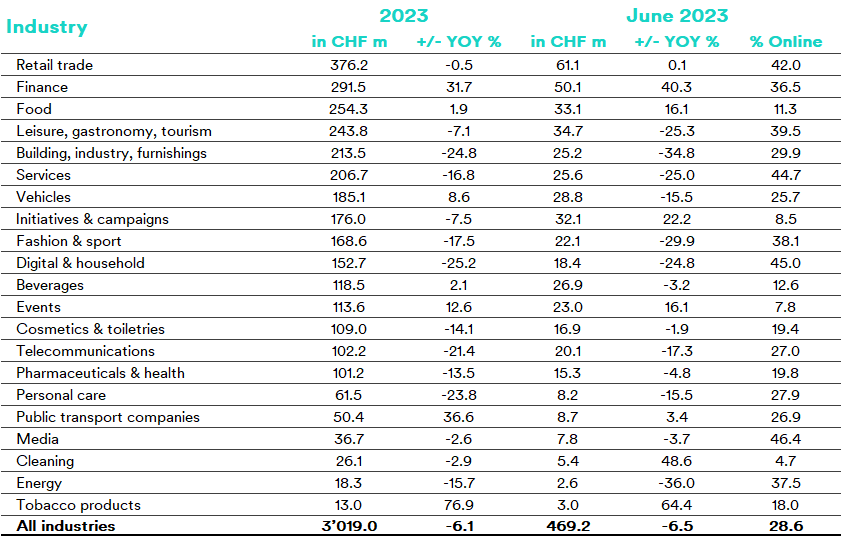
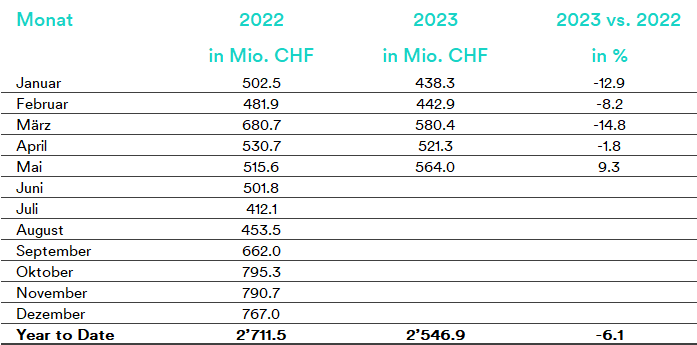
The outcome of the first six months of the advertising year has been revealed – CHF 3,019 million gross. This represents a drop of 6.1 percent. A total of 14 sectors are lagging behind last year’s figures (YTD).
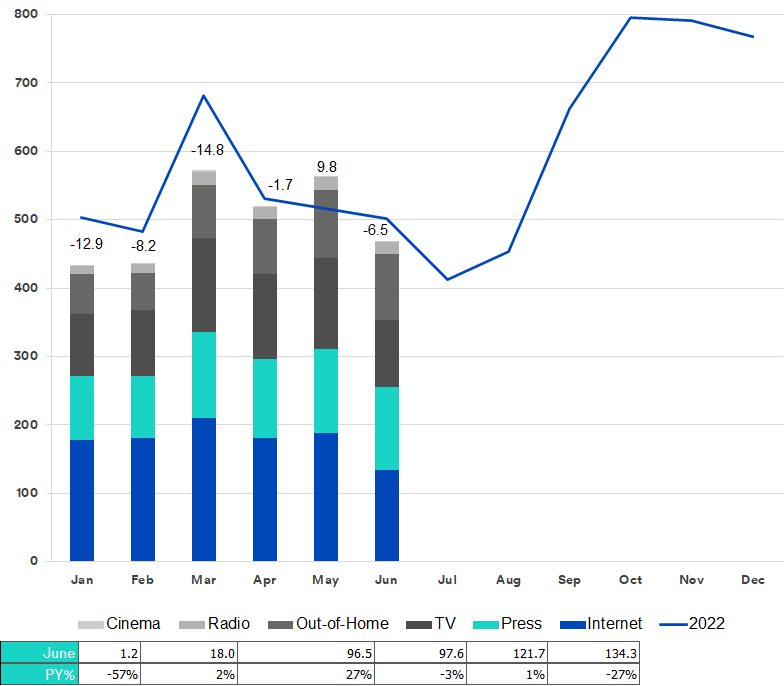
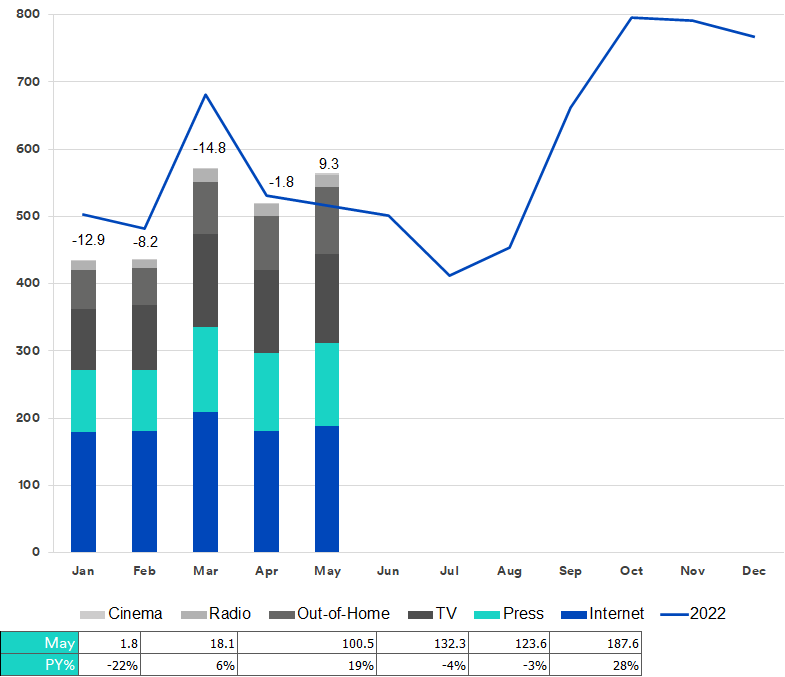
After May’s 9.3 percent rise, the dampening of advertising pressure in June once again heralded the arrival of the summer slowdown. In June, the advertising market showed a drop of 6.5 percent compared to the previous year, closing out at a gross figure of CHF 469 million. This development has certainly been driven by a disproportionate decline in searches*. The conventional channels have actually shown an uptick of 5.7 percent. The biggest influence here was the out-of-home media group, with an increase of 27 percent in comparison with 2022.
*Google has also integrated their AI “Bard” into Google Search since mid-May 2023. As a result, the internal structure of the HTML pages was adjusted in both desktop and mobile search. We had to follow up on these changes in our system, which in some cases resulted in fewer ads being recorded in June than in previous months. This results in a break in the trend in June 2023. Ad capture is now back to normal levels. We regret the circumstances and will carefully monitor further changes from Google.
Advertising pressure in the market as a whole
Advertising pressure development up to June 2023 in CHF million gross
Strong performance in finance in June and in the YTD
In June, the finance sector recorded a significant increase in advertising pressure (+40.3%) and shows a strong presence in the sector ranking for the year to date with a rise of 31.7 percent. This means it comes up in second place in the mid-year financial statements.
Although retail has generated more advertising pressure in the YTD, it stagnated in June (-0.5%). The food industry managed to increase its advertising pressure both in June (+16.1%) and in the YTD (+1.9%), coming in at third place.
Compared to the previous year, only eight sectors achieved an increase in June. The tobacco industry, which, along with a noticeable increase in June (+64.4%), also enjoyed a considerable rise in the YTD (+76.9%), came out on top. With strong campaigns on climate protection legislation, the initiatives & campaigns sector was also able to record an increase (+22.2%), and cleaning also made considerable gains (+48.6%).
Cultural activities, including concerts, open-air shows and sports events such as the Weltklasse Zürich, fired up the events sector, which, like the food industry, rose by 16.1 percent.
Last but not least, advertising pressure in the public transport sector also rose in June (+3.4%).
Nine sectors record double-digit declines
A total of 13 sectors reduced their advertising pressure, and nine of those recorded double-digit declines.
The largest drop can be seen in the energy industry, which showed a decline of 36 percent in terms of advertising pressure. Even the construction, industry and furnishings sector, which made it into the top five in the YTD, saw a considerable drop (-34.8%).
As in May, the fashion and sports sector, with a reduction of 29.9 percent, showed the third-greatest decline, despite coming in at around average in the YoY comparison.
Despite summery temperatures, advertising activities in the leisure, gastronomy and tourism sector – with and without searches – remained quiet (-25.3%). The services sector (-25.0%) was also one of the five sectors with the biggest declines in June.
Top advertisers and products
The top advertisers and most advertised products and services (excluding range, image and other advertising) in June
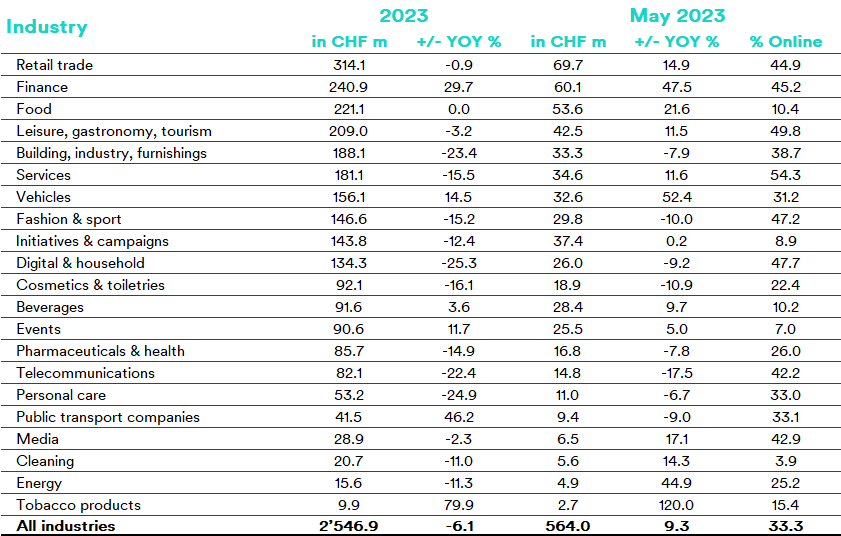
Both billboard advertising (+19%) and online advertising (+28%) drove the Swiss advertising market, resulting in gross advertising pressure of CHF 564.0 million, up 8.2 percent on the previous month. Compared to the previous year, the advertising market recorded an increase of 9.3 percent.
However, advertising pressure for the current year (YTD) is still 6.1 percent behind 2022 at CHF 2,546.9 million gross. In comparison, in 2019, the last year before the slump caused by the coronavirus pandemic, the CHF 3 billion mark had already been exceeded by May. We are eagerly awaiting June and the half-year results.
Advertising pressure in the market as a whole
Advertising pressure development up to May 2023 in CHF million gross
Top three sectors showing stability
A total of 13 industries increased their advertising pressure in May. The top three, retail (+14.9%), finance (+47.5%) and food (+21.6%), were also able to consolidate their leading position in May. As was the case in April, the finance sector was also able to report the third-highest increase in May. Only the tobacco sector (+120%) and the automotive sector (+52.4%) showed even stronger growth.
Other sectors with strong advertising performance in May were energy (+44.9%), media (+17.1%), cleaning (+14.3%) and services (+11.6%).
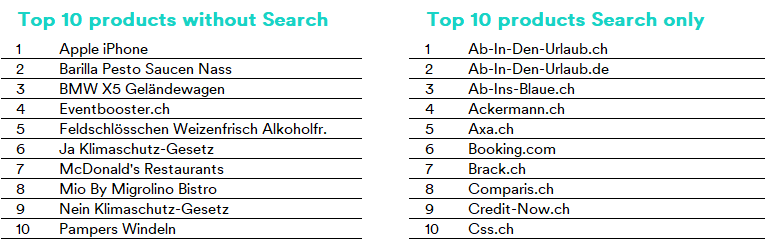
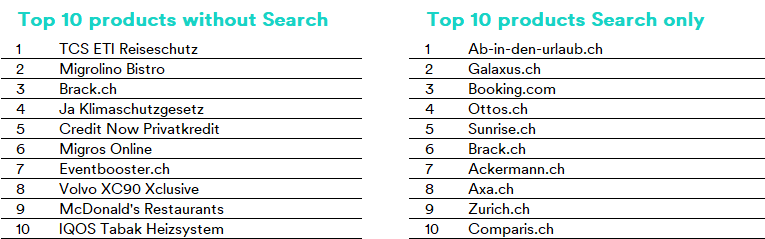
Warmer temperatures make people want to go on vacation, and this is also reflected in the leisure, gastronomy and tourism sector (+11.5%), and the top products with search (Ab-in-den-urlaub.ch) and without search (TCS ETI travel insurance).
Cosmetics and toiletries sees a further reduction
In May, a total of eight industries reduced their advertising pressure, although only three showed a double-digit reduction.
The telecommunications sector recorded the highest reduction with a drop of 17.5%. The cosmetics and toiletries sector also reduced its advertising pressure, as in April, recording a decrease of 10.9%. The third highest reduction was recorded in the fashion and sport sector, with a decrease of 10%. Interestingly, all three sectors also reported a year-on-year decline.
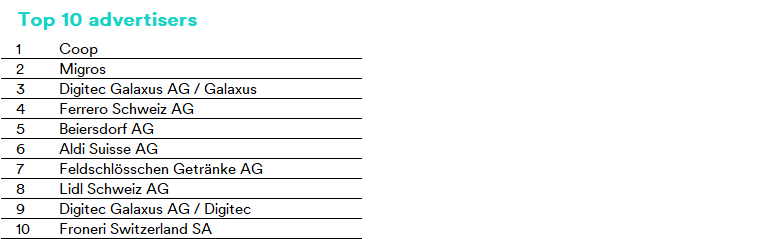
Top advertisers and products
The top advertisers and most advertised products and services (excluding range, image and other advertising) in May
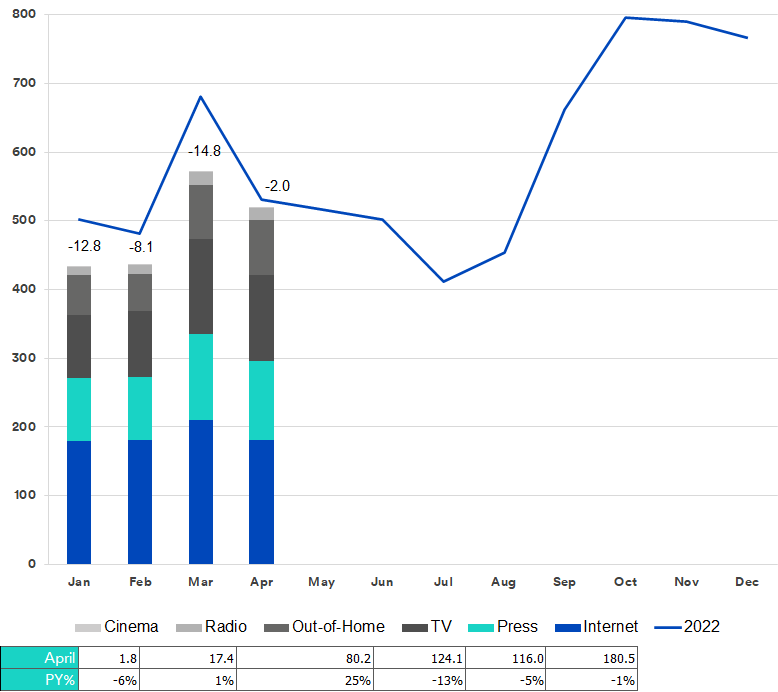
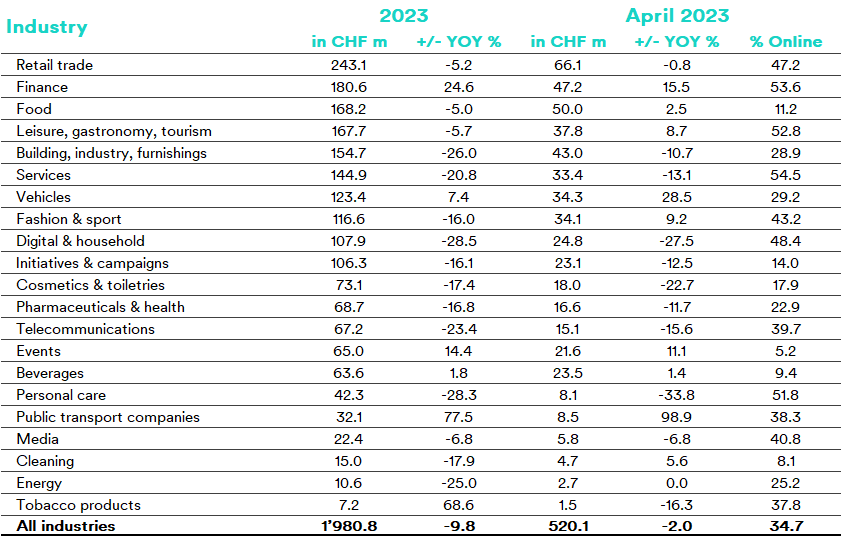
After a strong advertising month in March, advertising pressure decreased by 10% in April as usual, closing with CHF 520.1 million gross. Although 11 out of 21 sectors reduced their advertising pressure, the month of April was only slightly down on the previous year with minus 2%.
As in the previous month, public transport (+98.9%) and finance (15.5%) continued to increase their advertising activities in April, with the vehicle industry also strengthening its advertising (+28.5%).
The biggest decreases compared to the previous year can be seen in the personal care (-33.8%), digital & household (-27.5%) and cosmetics and toiletries (-22.7%) sectors.
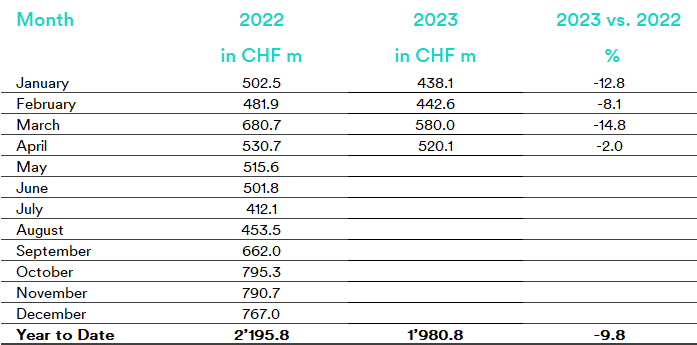
At CHF 1,980.8 million gross, total advertising pressure for the first four months of the year is down by 9.8% on the annual advertising pressure of 2022.
Advertising pressure in the market as a whole
Advertising pressure development up to April 2023 in CHF million gross
Public transport and finance continue to increase
As in the previous month, public transport (+98.9%) saw a significant increase in April. The sector is therefore up 77.5% on the previous year’‘s value for the current year, recording the biggest percentage increase in comparison to all other sectors.
The vehicle industry also ramped up its advertising activities in April (+28.5%). With the VW California and the Opel Corsa Now+, two products from the sector are now among the top 10 most advertised products.
The finance sector recorded the third highest increase (+15.5%) in comparison to the previous year, coming in strong overall with a YTD increase of 24.6%.
Personal care still defensive in advertising in April
Of the 21 sectors, 11 reduced their advertising pressure in April. Particularly notable is the decline in the personal care (-33.8%) sector, a sector that had already recorded a decline of 43.3% in March.
Advertising continues its decline in the digital & household sector (-27.5%). Both sectors are therefore more than 20% down on the previous year’s value for the current year.
Other sectors recording two-digit decreases in April include cosmetics and toiletries (-22.7%), tobacco products (-16.3%), telecommunications (-15.6%), services (-13.1%), initiatives & campaigns (-12.5%), pharmaceuticals & health (–11.7%) and construction, industry and furnishings (-10.7%).
Top advertisers and products
The top advertisers and most advertised products and services (excluding range, image and other advertising) in April
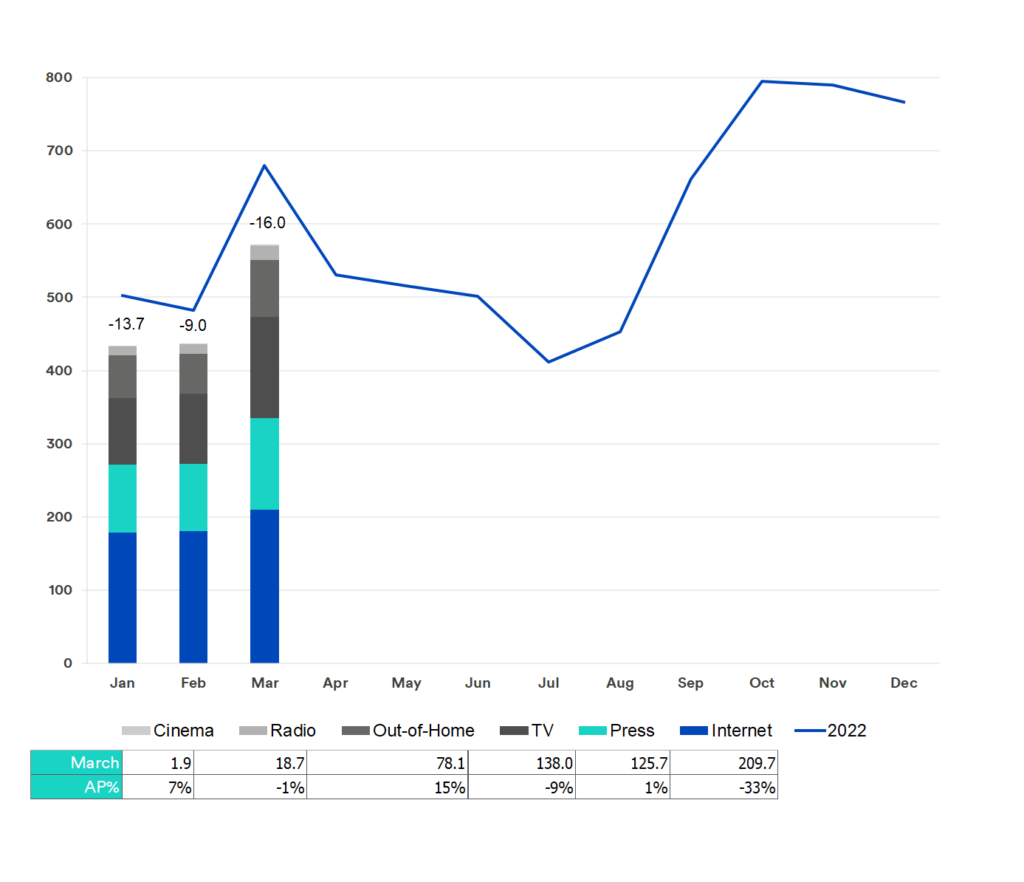
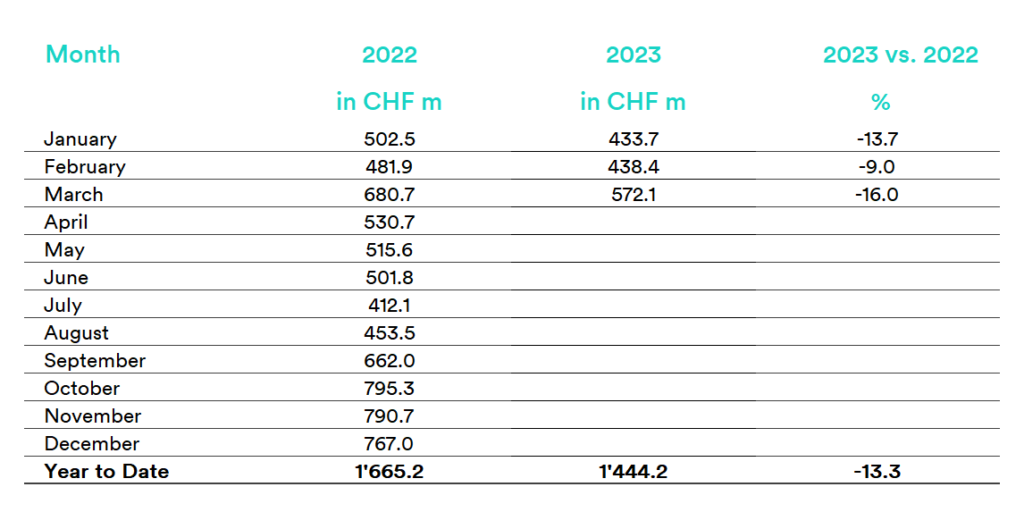
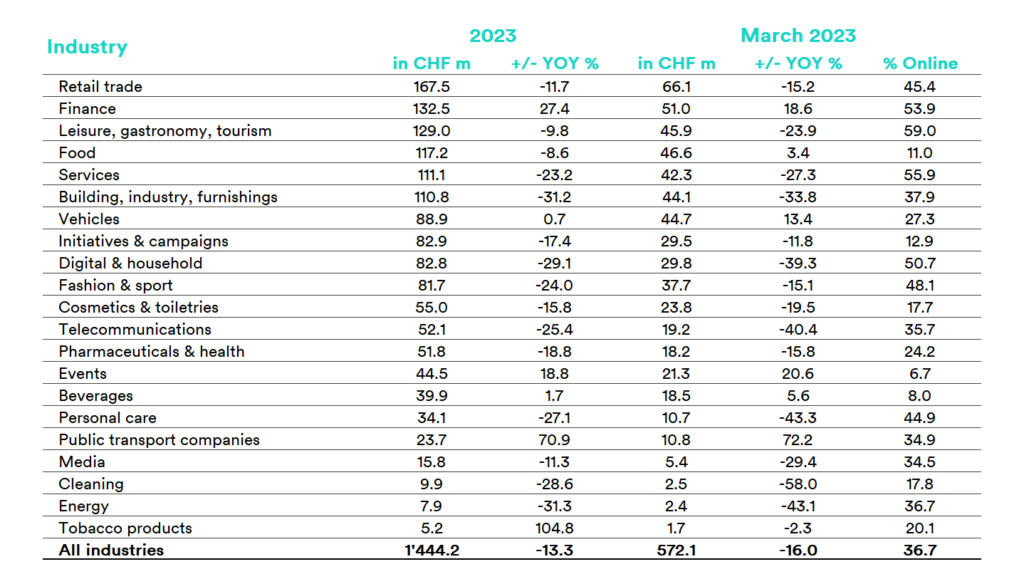
As in previous years, the Swiss advertising market once again recorded significant March growth in 2023. The spring month closed on a high of CHF 572.1 million gross, representing an increase of 30.5 percent compared to the previous month. Nevertheless, this trails behind the figure for March 2022 by 16 percent.
The public transport (+72.2%), events (+20.6%) and finance (+18.6%) sectors in particular saw a sharp increase in advertising impact in March, contributing to this positive trend.
The Swiss advertising market received a boost during the first quarter of 2022, closing with CHF 1,444.2 million gross.
Advertising pressure in the market as a whole
Advertising pressure development up to March 2023 in CHF million gross
Public transport recorded a significant increase
The largest increase in advertising pressure was recorded by the public transport sector, with an increase of 72.2 percent, followed by the event sector with an increase of 20.6 percent. Also among the winners in March was the finance sector, which increased its gross advertising pressure by 18.6 percent, followed by automotive (+13.4%), beverages (+5.6%) and food (+3.4%).
Overall decline in 15 sectors
No less than 15 sectors recorded a decline in gross advertising pressure in March . The cleaning sector was the most affected, with a drop of 58 percent, followed by the personal care sector, with a decline of 43.3 percent. Other sectors that saw a decline in advertising pressure were energy (-43.1%), telecommunications (-40.4%), digital and household (-39.3%), construction, industry and furnishings (-33.8%), media (-29.4%), services (-27.3%), leisure, gastronomy and tourism (-23.9%), cosmetics and toiletries (-19.5%), pharmaceuticals and health (-15.8%), retail (-15.2%), fashion and sport (-15.1%), initiatives and campaigns (-11.8%) and tobacco products (-2.3%).
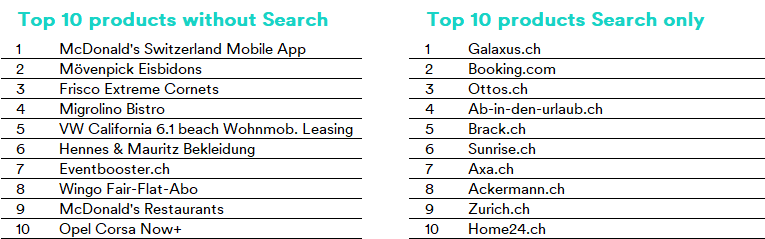
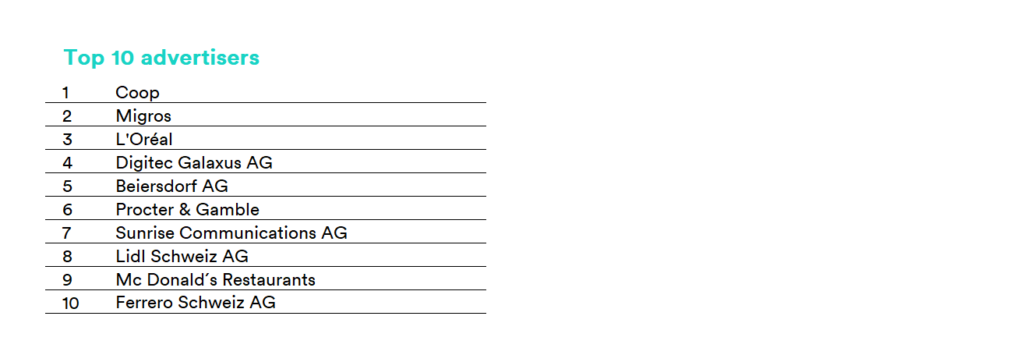
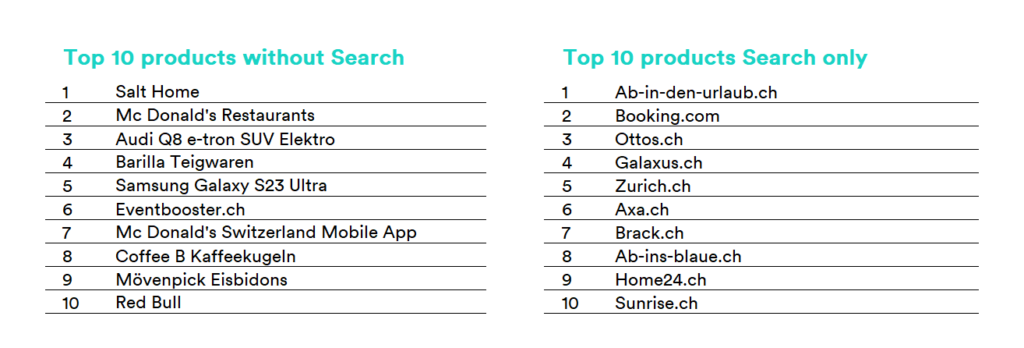
Top advertisers and products
The top advertisers and most advertised products and services (excluding range, image and other advertising) in March
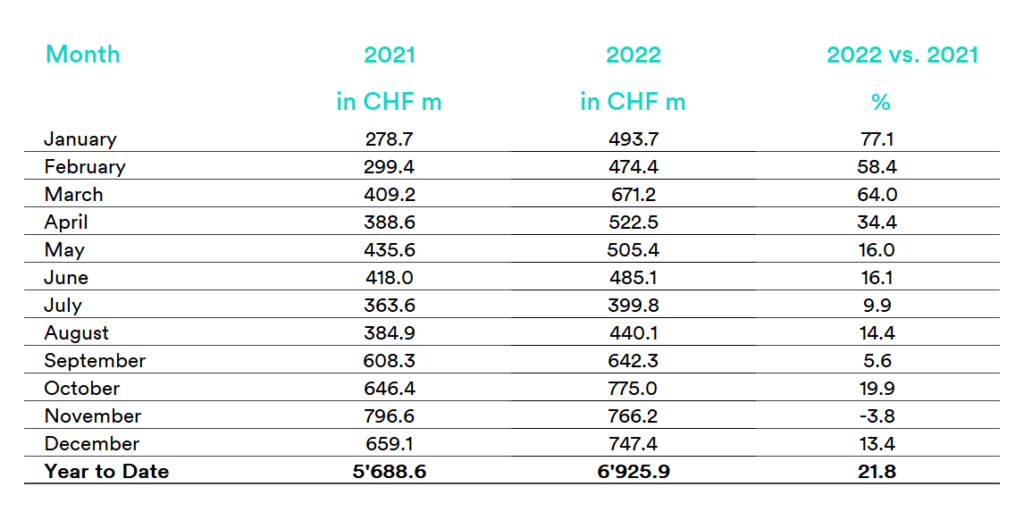
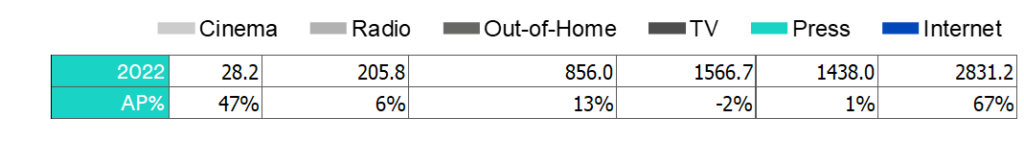
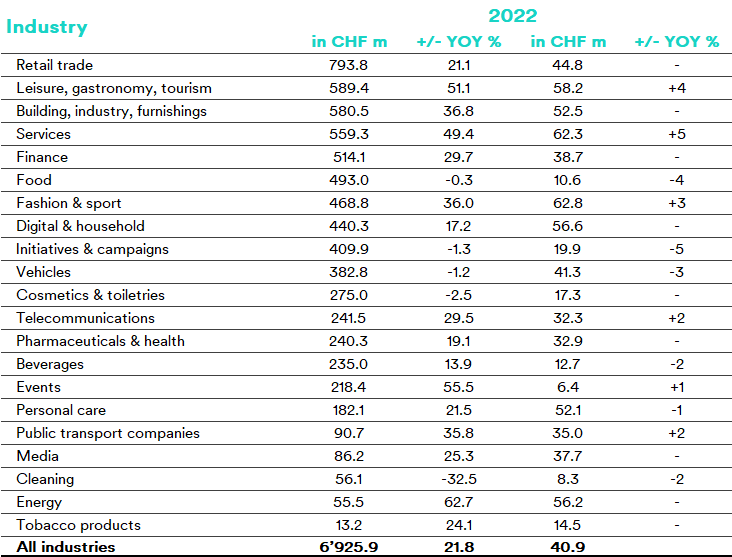
CHF 6.926 million of gross advertising pressure was generated in 2022 (+21.8%). The media channels of global tech giant Google (SEA, YouTube) accounted for around a third of this (35.8%; CHF 2.483 million).
Excluding this advertising space, the gross advertising pressure generated by the media categories of print, TV, radio, cinema, out-of-home and display advertising statistics is CHF 4.443 million.
This corresponds to a 3.8% (+CHF 162 million) increase on the previous year.
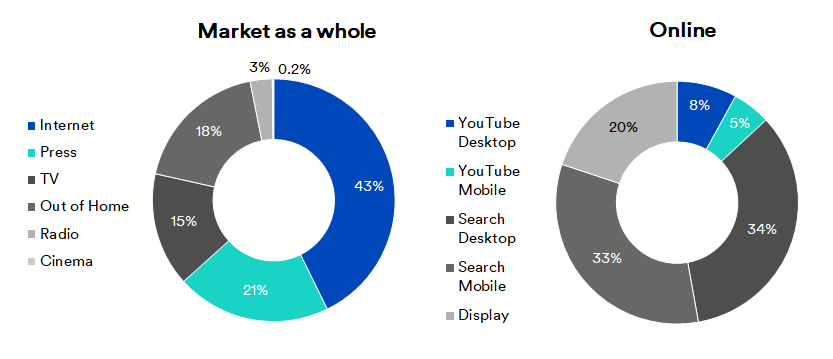
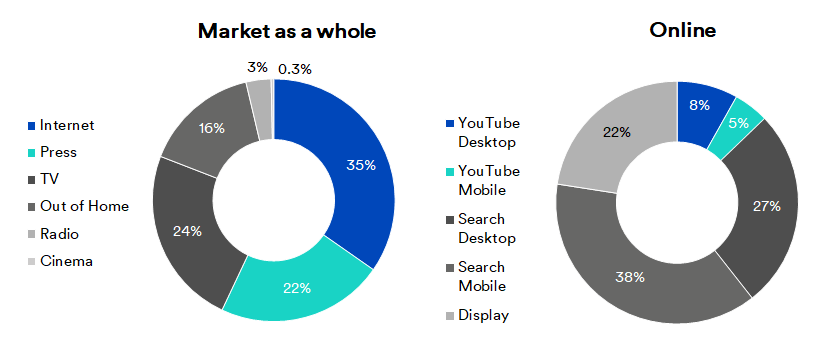
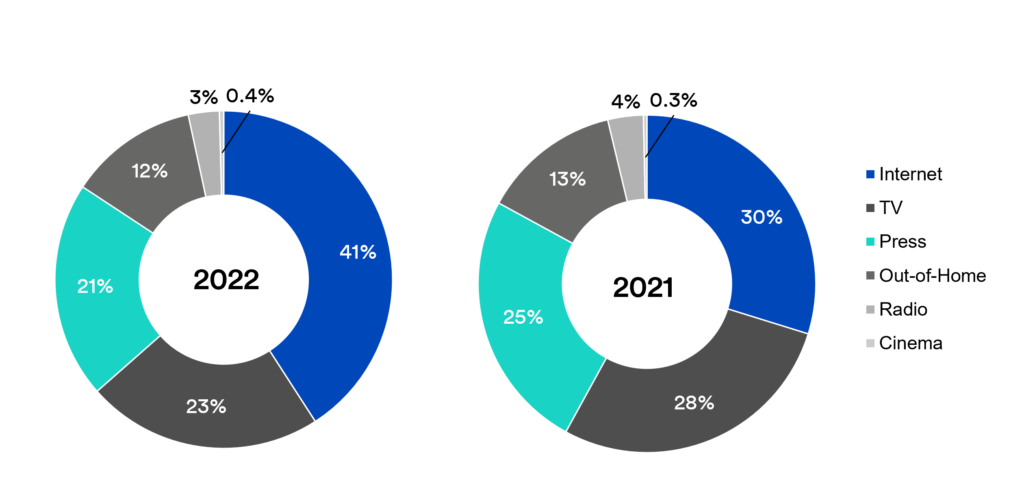
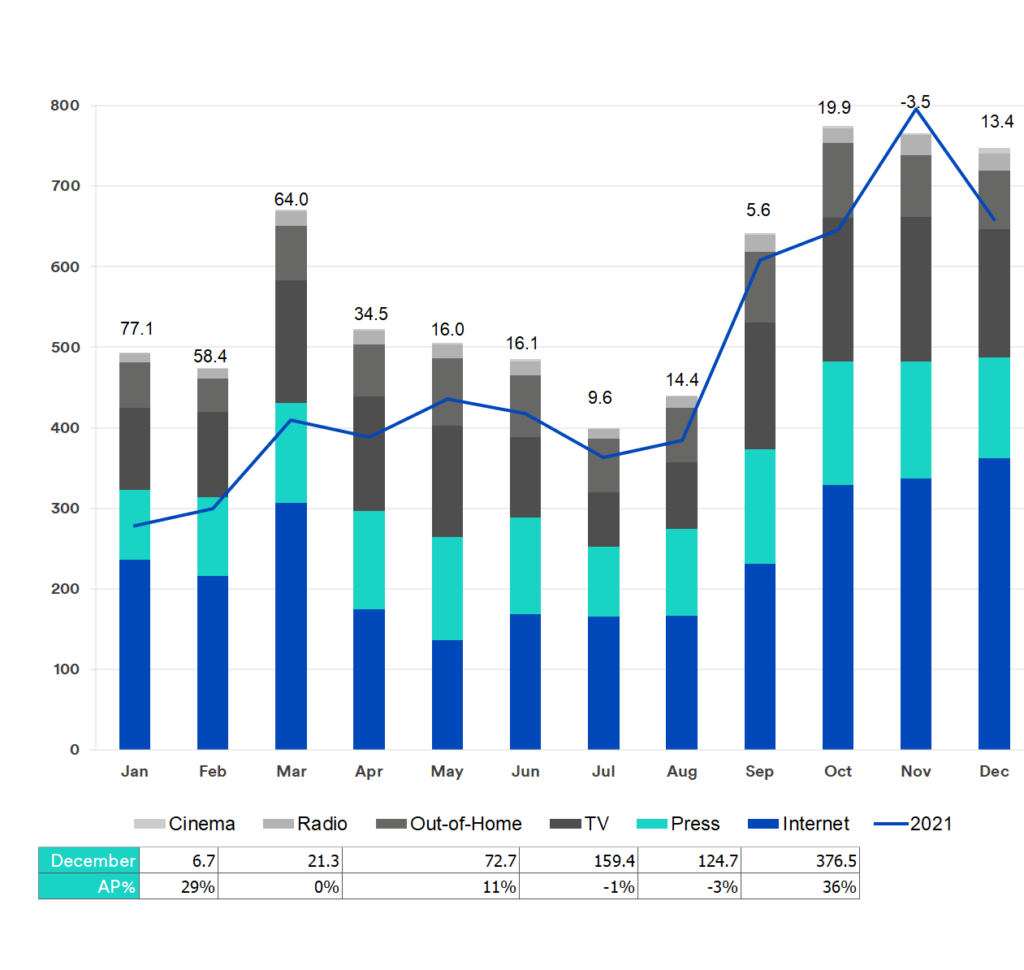
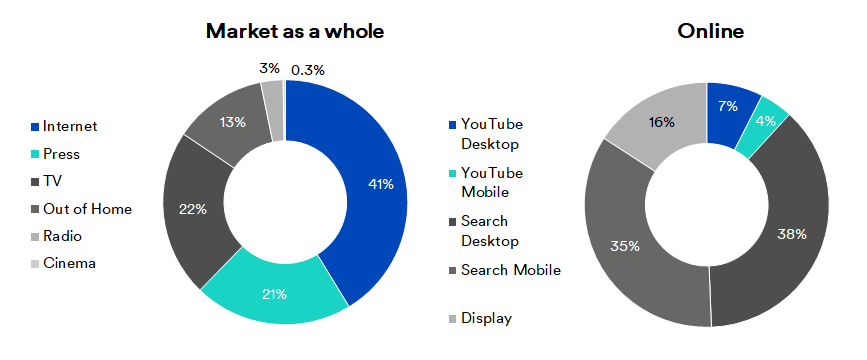
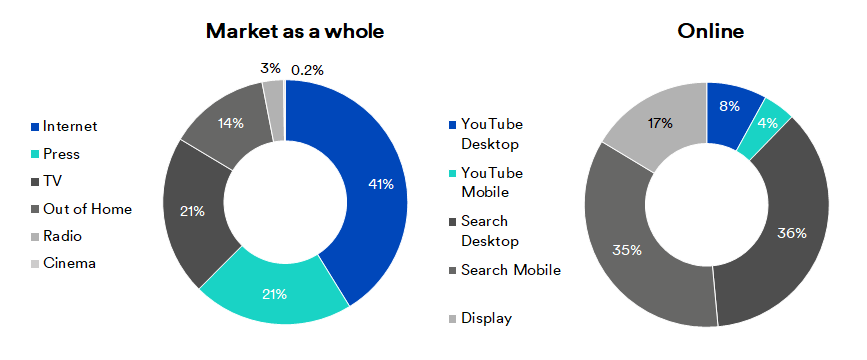
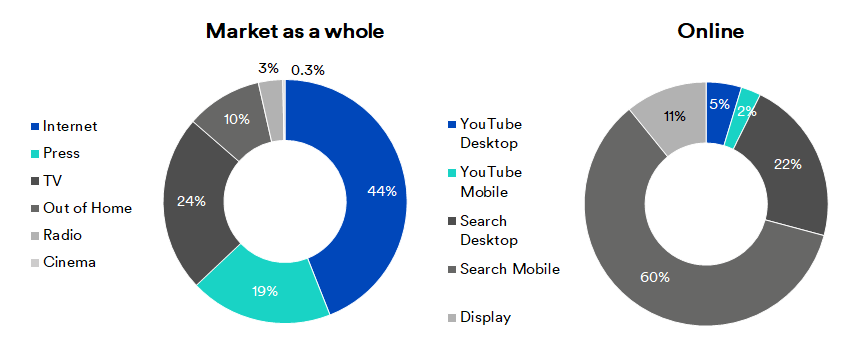
Media mix developments compared to the previous year
Internet will remain the dominant media category in 2022, with a 41% share of the media mix*. TV advertising comes second, at 23%. In third place, print generates around a fifth of the advertising pressure (21%), followed by out-of-home (12%), radio (3%) and cinema (0.4%).
Looking at how advertising pressure has developed in the individual media categories, it is noticeable that only TV advertising is slightly below the previous year’s value (-2.3%). Internet advertising (search, display and YouTube) experienced the greatest growth, at 67.1%. Cinema came second, with growth of 46.8%. The figures are still well below the pre-Covid figures from 2019 (CHF 28 million vs. CHF 49 million), but the trend is heading in the right direction, not least due to the blockbuster movie Avatar 2. Out-of-home completes the list of media groups, with double-digit growth (+13.1%). Following its significant increase last year, radio again grew by 6.3% thanks to the integration of new stations in western Switzerland. Print advertising was also slightly up, at 1.2%.
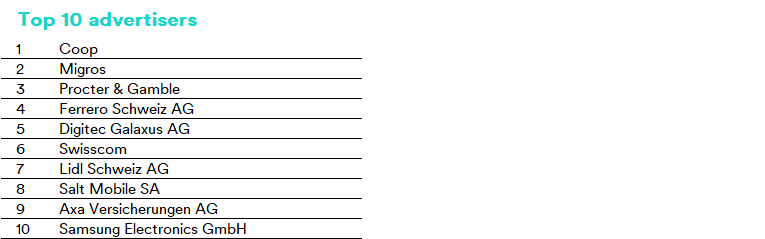
The long tail is growing – top 100 advertisers still generating 42.7% of the advertising pie
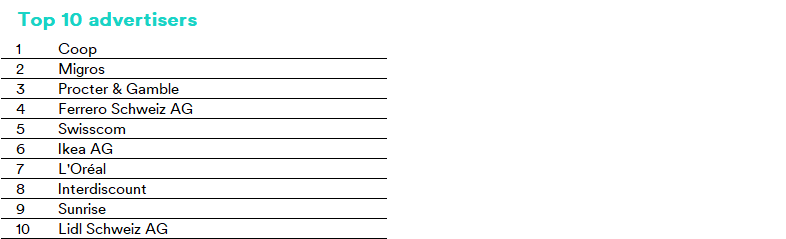
In 2022, around 28,400 advertisers in Switzerland placed advertising. Of these, 4,306 were new entries in the statistics in 2022. The growth in online advertising is strengthening long tail advertising. The top 10 advertisers are generating proportionally less advertising pressure than in the previous year (16.4%). In 2021 they accounted for 18.9%, and in 2020 19.3% of the total advertising pressure. The top 20 are still responsible for 22% of the advertising pressure (2021: 24.6%, 2020: 25.1%), the top 100 for 42.7% (2021: 47.4%, 2020: 48.2%).
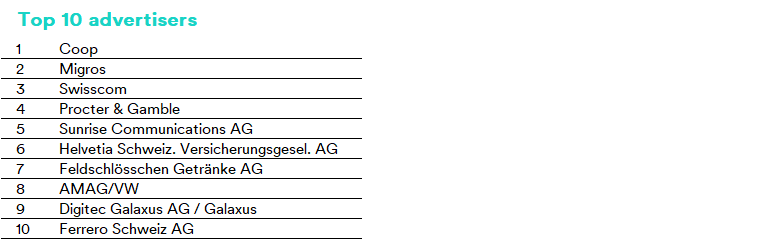
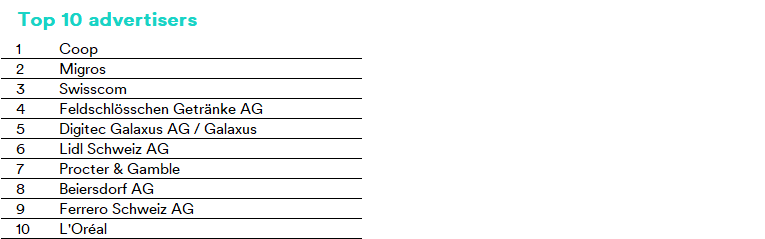
There is hardly any movement among the leaders of the top 10 advertisers. Coop and Migros remain unchallenged in the top two spots, followed by Procter & Gamble, Ferrero and Swisscom. Contrary to the market trend, the latter three companies reduced their advertising pressure in 2022 compared to the previous year, in some cases significantly (-13.3% to -25.3%).
Ikea (6, 2021: 13) and Sunrise (9, 2021: 17) moved up a few places compared to the previous year. Aldi (2021: 10) did not appear in the top 10 in 2022.
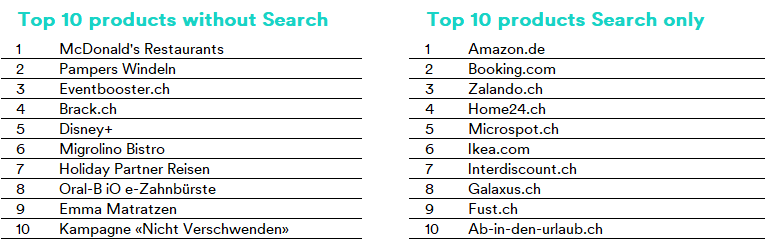
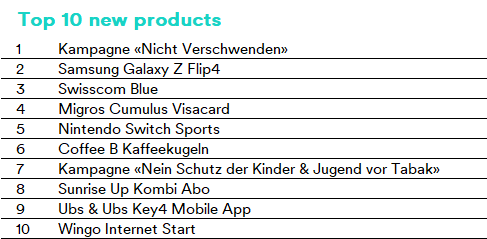
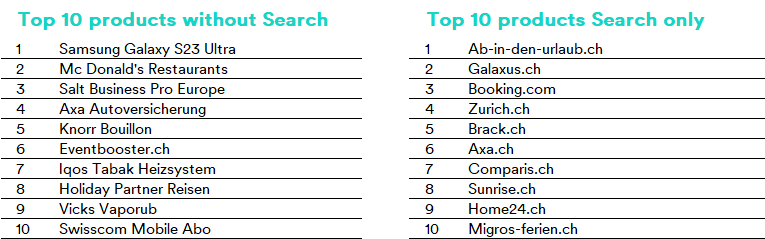
Top advertisers & products
Top advertisers and most advertised products and services (excluding assortment, image advertising and collective categories) 2022.
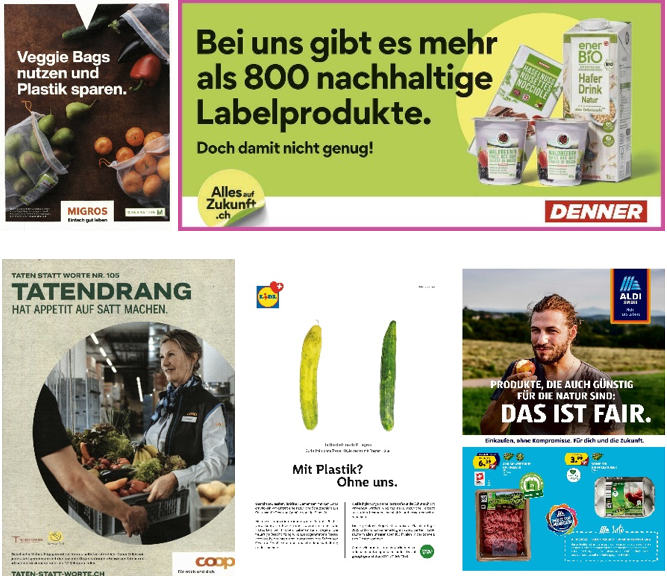
Coop and Migros leading the pack in sustainability communication
Analysis of the advertising activities of large retailers in Switzerland shows that Coop and Migros are ahead of the competition in 2022 when it comes to advertising communication relating to sustainability issues. Coop (“Actions, not words”) is just ahead of Migros (“Generation M” and “M-Check”). Third place goes to Migros subsidiary Denner (whose slogan translates as “Putting everything into the future”), followed by Lidl (“Said and done”) and Aldi (“Working today for tomorrow”).
Sector trends in 2022
Retail continues to occupy pole position. In second place is now the Leisure, gastronomy, tourism, which jumped up four places in total compared to the previous year. Only service industry (+5 places) climbed by a higher number of places. This is mainly due to the above-average online focus of these two sectors. In addition, the fashion and sport (+3 places), telecommunications (+2 places), transport companies (+2 places) and events (+1 place) also saw increases.
Initiatives & campaigns recorded the biggest decline, falling five places. The food sector slipped down four places. The vehicle industry dropped three places, followed by beverages (-2 places), cleaning (-2 places) and personal needs (-1 place).
Conclusion
Despite the multi-pronged crisis that the world is undergoing at present (the war in Ukraine, the energy crisis, inflation, etc.) and the general sense of uncertainty, the Swiss advertising market regained strength in 2022. The year-on-year comparison is particularly positive. However, advertising volumes in most media groups, with the exception of out-of-home (with and without the integration of live systems) and online, are still below the values seen before the Covid-19 pandemic.
In addition, advertising activities are increasingly shifting into the digital space, where foreign players skim off the advertising pressure. “Traditional media” will have to come up with strategies if they are not to lose even more relevance.
*To ensure comparability with the previous year, the programmatic data integrated into the display delivery statistics since 2022 were excluded. With these included, the display media category shows an increase of around 30%.
Highlights in December
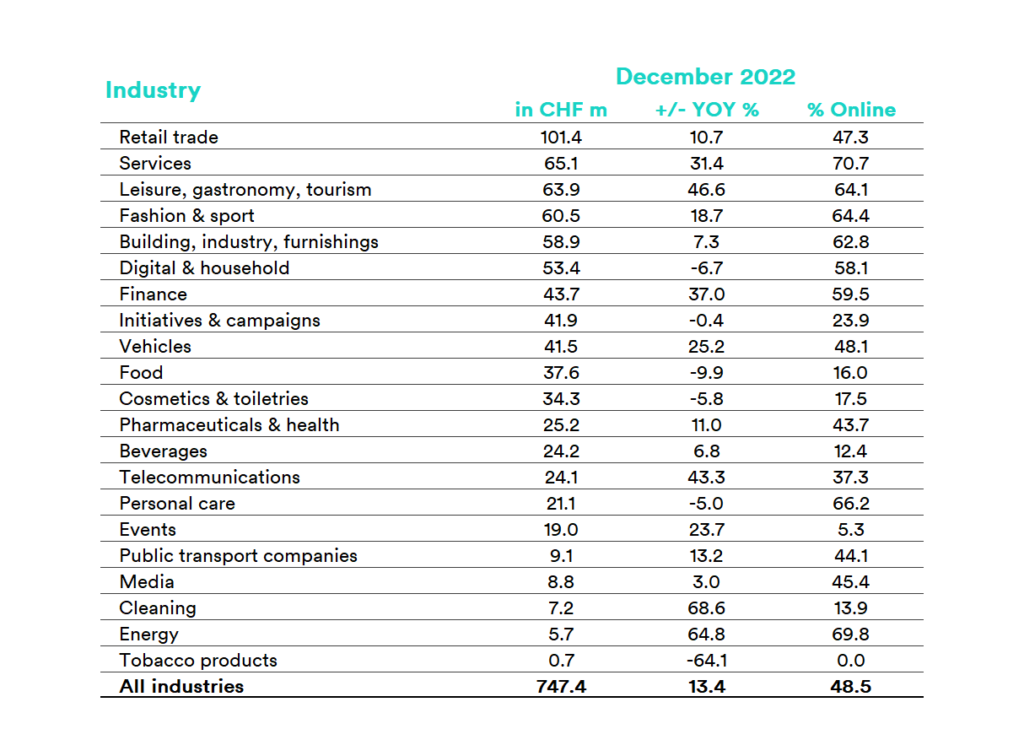
Compared to the previous year, figures for the month of December are 13.4% higher, with 747.4 million gross advertising pressure. Nevertheless, this trails behind the figure for the same month in 2021, by 2.5%. A total of 15 industries were able to increase advertising pressure again in the final month of 2022. Only six of the 21 sectors reported a decline.
Advertising Pressure in the market as a whole Development of Advertising Pressure as per December 2022 in million francs (gross)
Cleaning sector shows strong growth
In December, the largest increase was achieved by the cleaning sector, with 68.6%. This was closely followed by the previous month’s leader, energy, at 64.8%. Other sectors that were once again able to significantly increase advertising pressure are leisure, gastronomy, tourism (46.6%), telecommunications (43.3%), services (31.4%) and vehicles (25.2%).
Tobacco industry sees over 50% drop in advertising pressure in December
With gross advertising pressure of CHF 1.0 million, the tobacco industry experienced the greatest decrease in advertising pressure when compared against other sectors, at -64.1%. The food (-9.9%), digital & household (-6.7%), cosmetics & personal care (-5.8%), personal needs (-5.0%) and initiatives & campaigns (-0.4%) sectors recorded a much smaller decline.
Top of the month
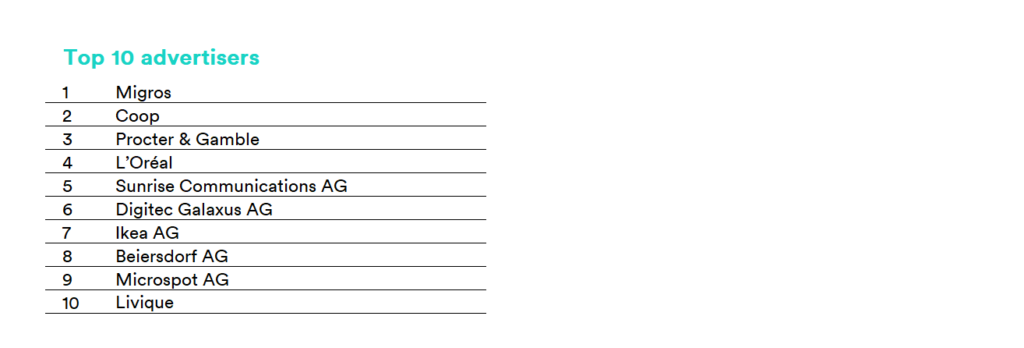
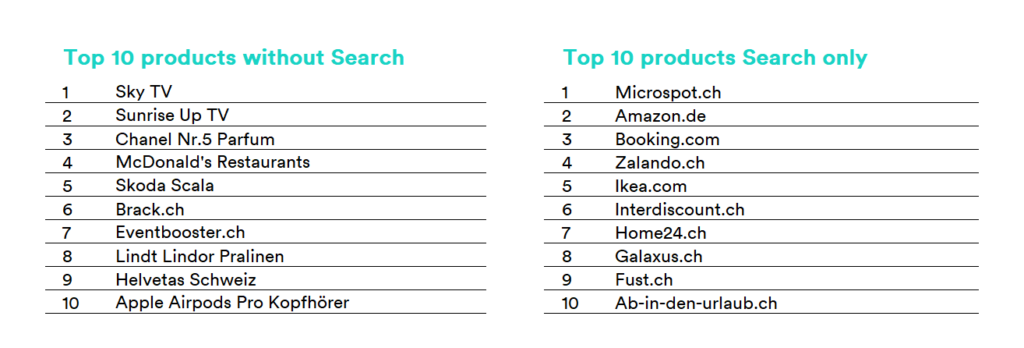
The top advertisers and most widely advertised products and services (excluding range, image and collective categories) in December
With Total Brand Visibility, Media Focus offers a product that compiles data about your media presence from advertising and reporting and then analyzes this.
Media Focus assists you by recording data about the advertising presence of your competitors and industry and analyzing advertising volume and campaign and brand strategies.
Media Focus offers every service you need for efficient media monitoring, helping you to keep track of everything and showing you how successful your communications activities have been.
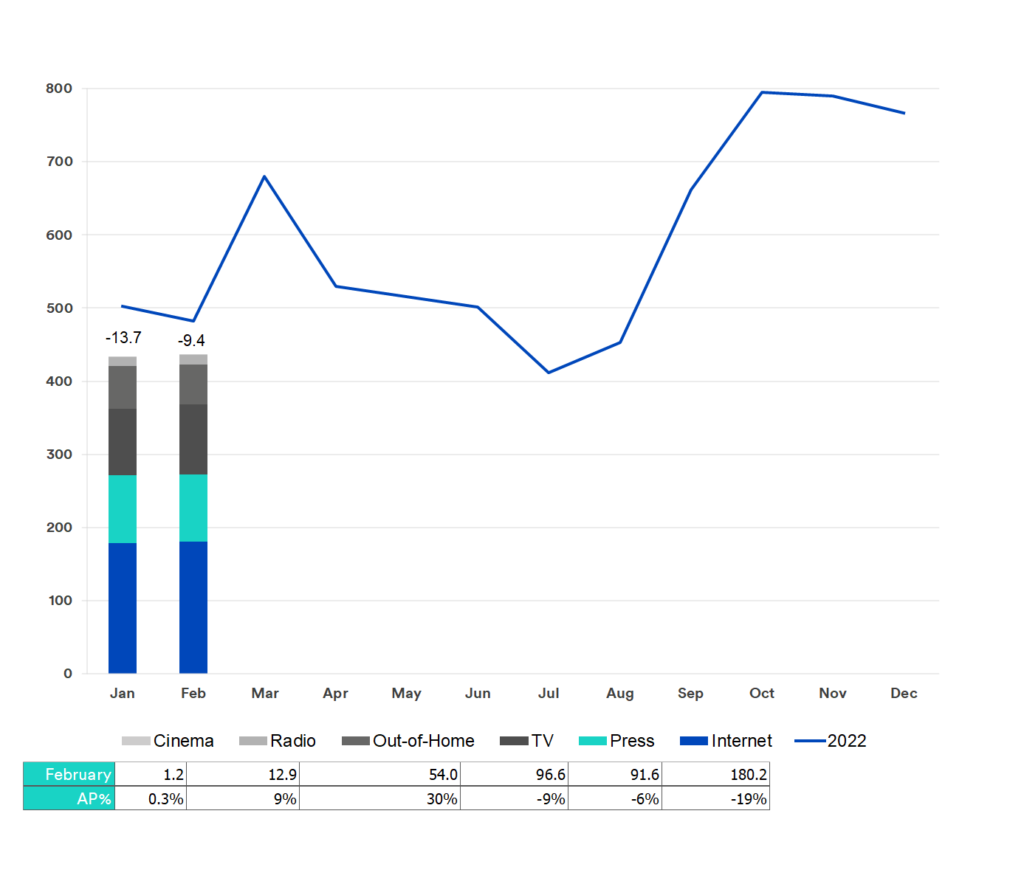
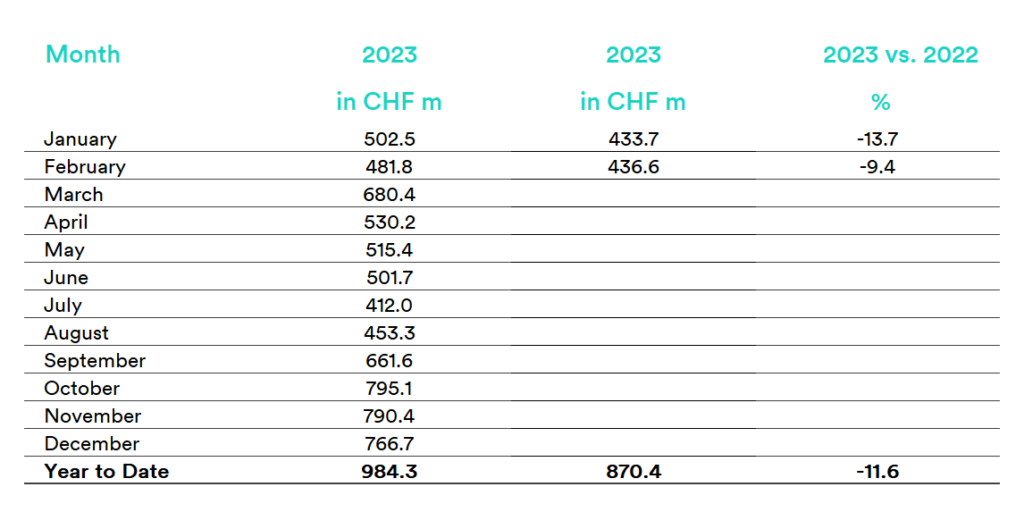
The Swiss advertising market closed February on CHF 436.6 million gross, down by 9.4% compared with the previous year. Compared with January 2023, however, gross advertising pressure increased slightly (+0.7%).
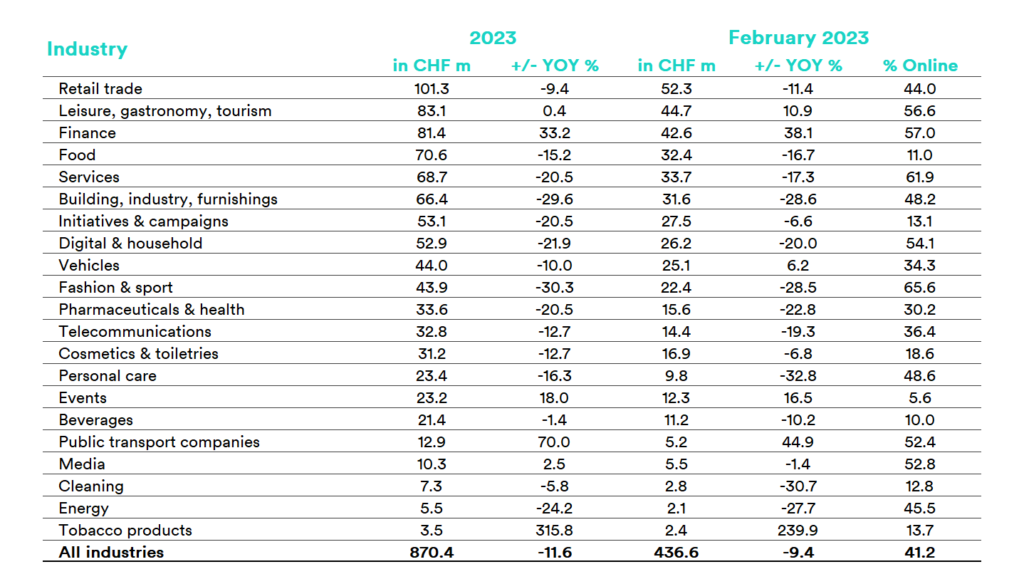
Meanwhile, the year-to-date gross total of CHF 870.4 million was down 11.6% compared with the previous year.
This decline can be attributed to the total of 15 sectors that generated lower gross advertising pressure in February. Just six sectors recorded an increase.
The top advertiser this month was Coop, and the most advertised product (without search) was the Samsung Galaxy S23 Ultra.
Advertising Pressure in the market as a whole Development of Advertising Pressure as per February 2023 in million francs (gross)
The tobacco industry records a significant increase
As in the previous month, January, the largest increase in advertising pressure was recorded by the tobacco industry, with an increase of 239.9%, followed by the transportation sector with an increase of 44.9%. Also among the winners in February was the financial sector, which increased its gross advertising pressure by 38.1%, followed by events (+16.5%), leisure, tourism, gastronomy (+10.9%) and vehicles (+6.2%).
Total decline of 9.4% across all sectors
No less than 15 sectors recorded a decline in gross advertising pressure in February. The personal care sector was the most affected, with a drop of 32.8%, followed by the cleaning sector, with a decline of 30.7%. Other sectors that saw a decline in gross advertising pressure were construction, industry, furnishings (-28.6%), fashion and sport (-28.4%), energy (-27.7%), pharmaceuticals & health (-22.8%), digital & household (-20.0%), telecommunications (-19.3%), services (-17.3%), food (-16.7%), retail (-11.4%) and drinks (-10.2%).
Top of the month
The top advertisers and most advertised products and services (excluding range, image and other advertising) in February
Media Mix
Media Mix (classic media) for the month of January
With Total Brand Visibility, Media Focus offers a product that compiles data about your media presence from advertising and reporting and then analyzes this.
Media Focus assists you by recording data about the advertising presence of your competitors and industry and analyzing advertising volume and campaign and brand strategies.
Media Focus offers every service you need for efficient media monitoring, helping you to keep track of everything and showing you how successful your communications activities have been.
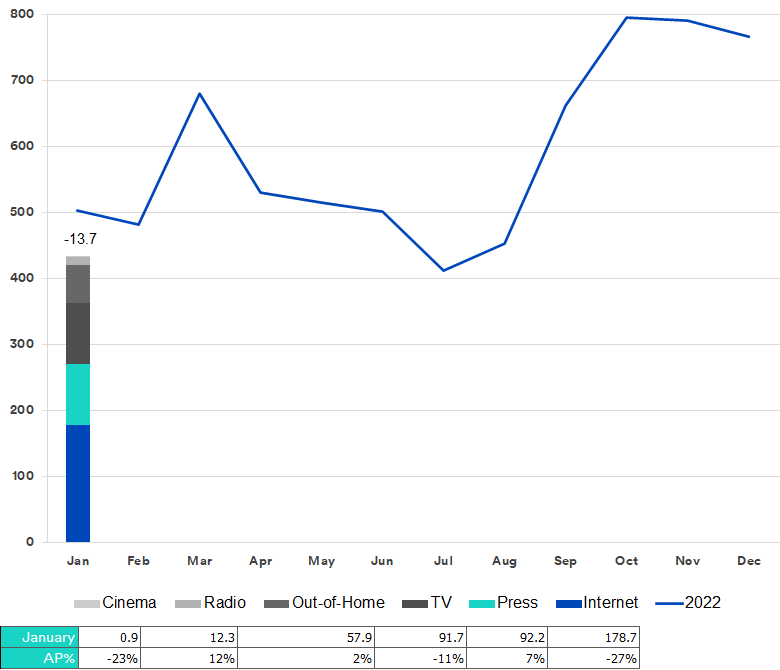
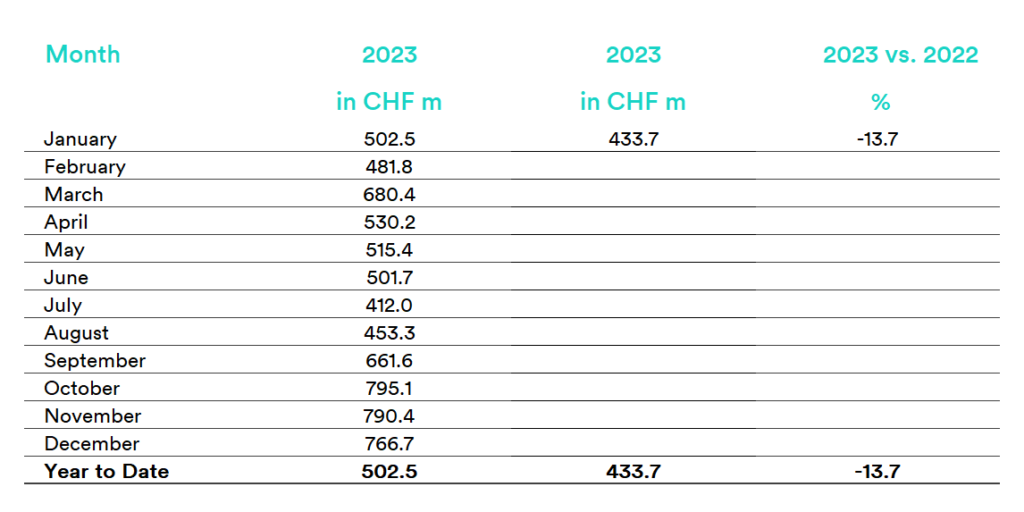
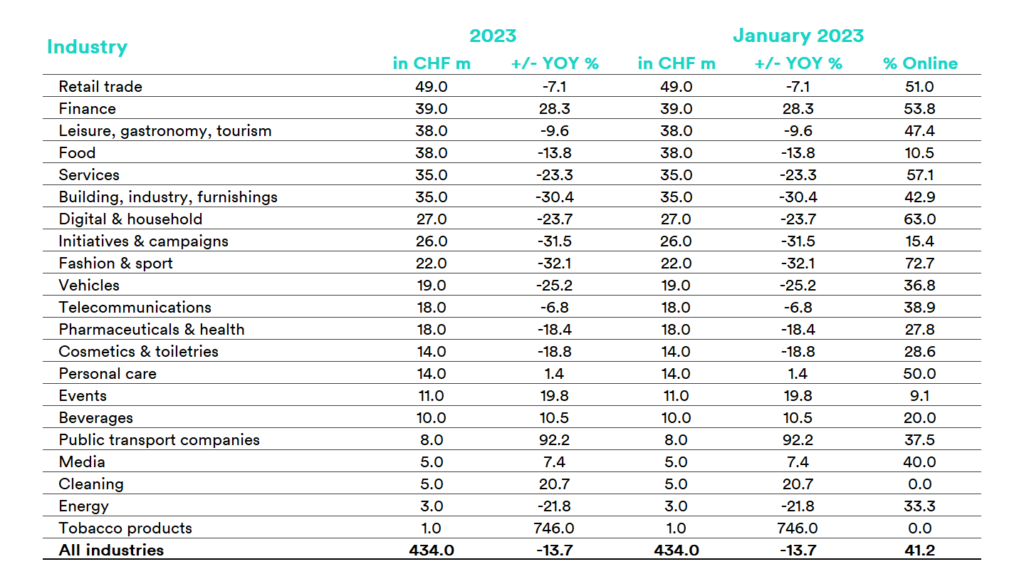
With CHF 433.7 million gross the Swiss advertising market is off to a slow start, albeit similar to last year, with a difference of −13.7% in 2023.
A total of 8 sectors have seen an increase in gross advertising pressure at the beginning of the New Year. The remaining 13 sectors reported a decline.
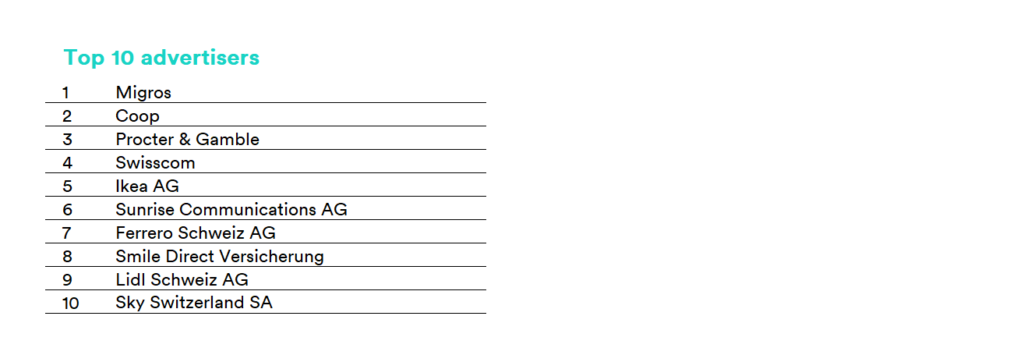
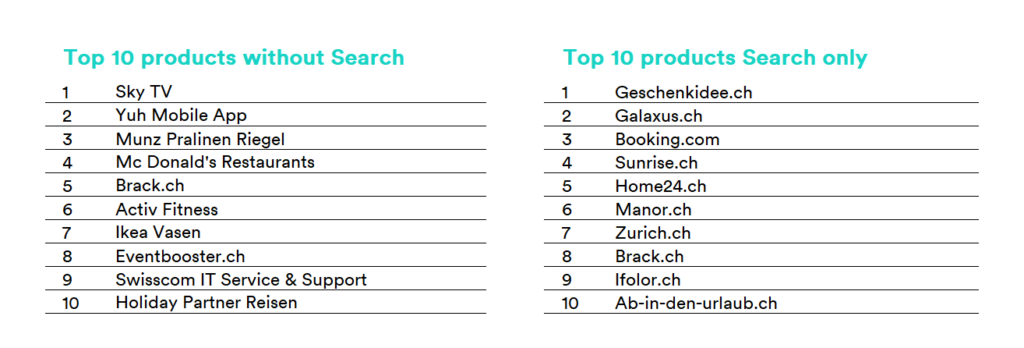
Migros achieved first place among the top advertisers in January. As in the previous month, at the start of the year the top product without search was Sky TV.
Advertising Pressure in the market as a whole Development of Advertising Pressure as per January 2023 in million francs (gross)
8 sectors record an increase on the previous year
In percentage terms, the tobacco industry is clearly on top, with an increase of 746%. In absolute terms, however, it is very weak. In January 2022, advertising pressure was only marginal. Transport companies are in second place, with a 92.2% increase in gross advertising pressure. The finance sector recorded another increase, at 28.3%. The cleaning sector also got off to a strong start in the new year, with gross advertising pressure rising by 20.7%.
The events (19.8%), drinks (10.5%), media (7.4) and personal care ( 1.4%) sectors have all seen further increases in gross advertising pressure.
Fashion & sports sectors see the biggest reductions
Advertising pressure declined in 13 sectors compared to the previous year. The fashion & sports saw the most significant reduction in gross advertising pressure, with a drop of 32.1%. This was followed by initiatives & campaigns, with –31.5%. The sectors of building & industry & furnishings (-30.4%), vehicles (–25.2%), digital & household (–23.7%), services (–23.3%), energy (-21.8%), cosmetics & toiletries (-18.8%), pharmaceuticals & health (–18.4%) and food (–13.8%) sectors also recorded double-digit falls.
Top of the month
The top advertisers and most widely advertised products and services (excluding range, image and collective categories) in January
With Total Brand Visibility, Media Focus offers a product that compiles data about your media presence from advertising and reporting and then analyzes this.
Media Focus assists you by recording data about the advertising presence of your competitors and industry and analyzing advertising volume and campaign and brand strategies.
Media Focus offers every service you need for efficient media monitoring, helping you to keep track of everything and showing you how successful your communications activities have been.
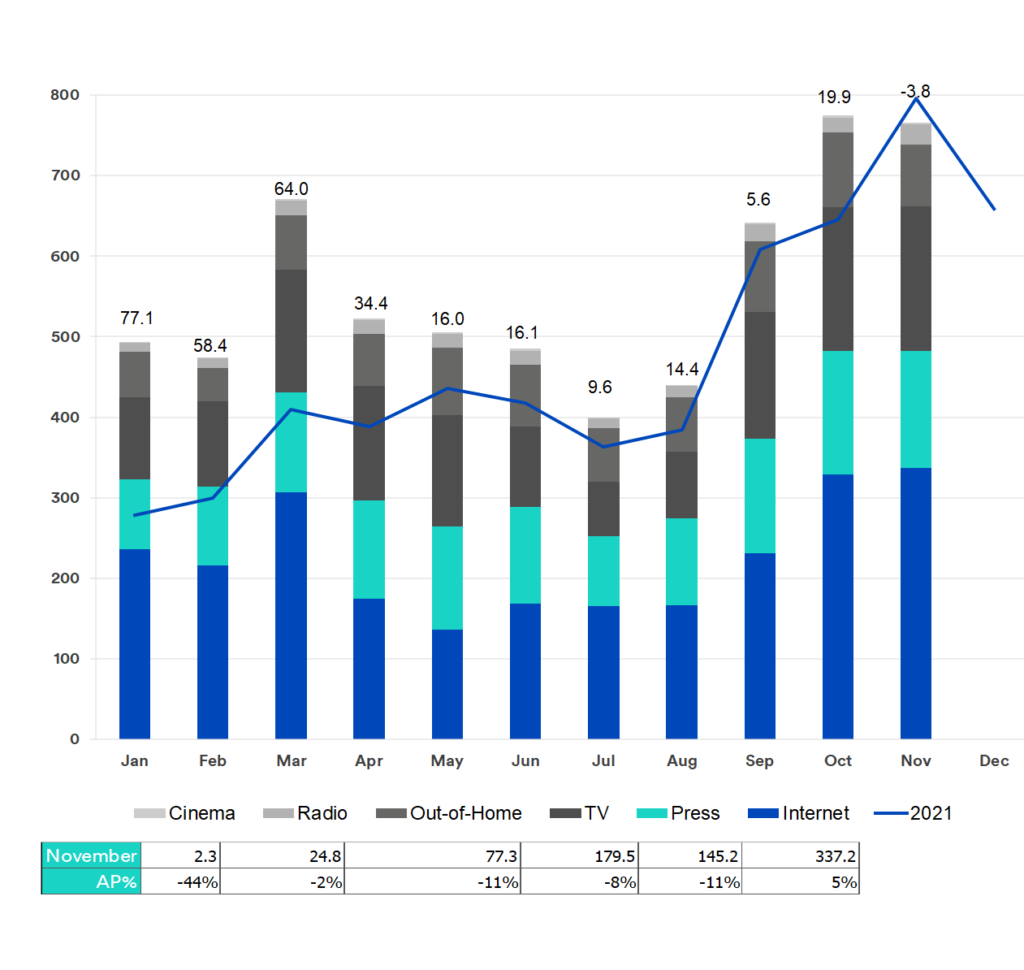
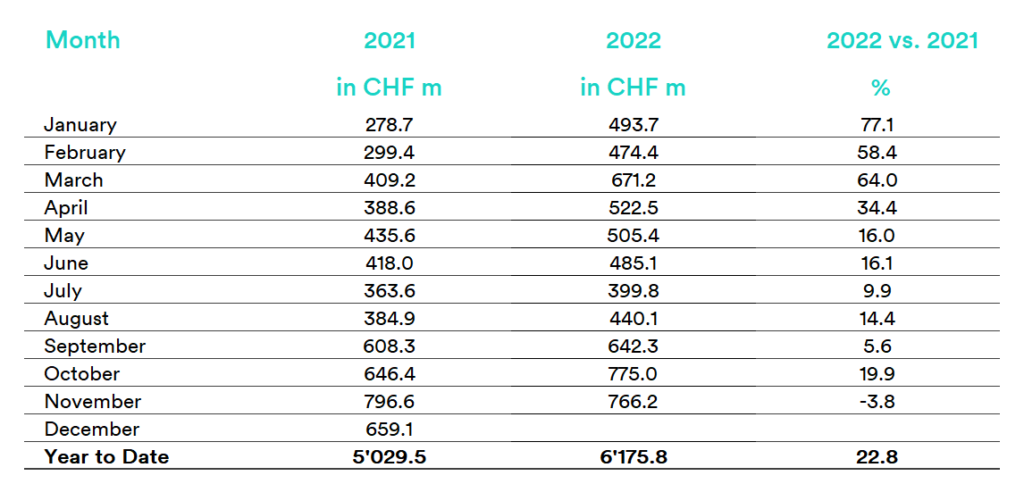
This November was once again a strong month and, with CHF 766 million gross, just missed the magic CHF 800 million gross mark. Pre-Christmas shopping, Black Friday and pricey TV advertising slots thanks to the World Cup in Qatar drove advertising pressure. However, the total still remained down on the same month last year (-3.8%) as well as the previous month of October (-1.1%). Decreases in traditional media groups were to blame, and the increase in the online segment was not enough to make up the difference.
Looking at the year as a whole, a positive picture does continue to emerge. One month before the end of the year, total gross advertising pressure amounted to CHF 6,175.8 million, up 22.8% on the previous year.
Advertising Pressure in the market as a whole Development of Advertising Pressure as per November 2022 in million francs (gross)
Energy sector flying high
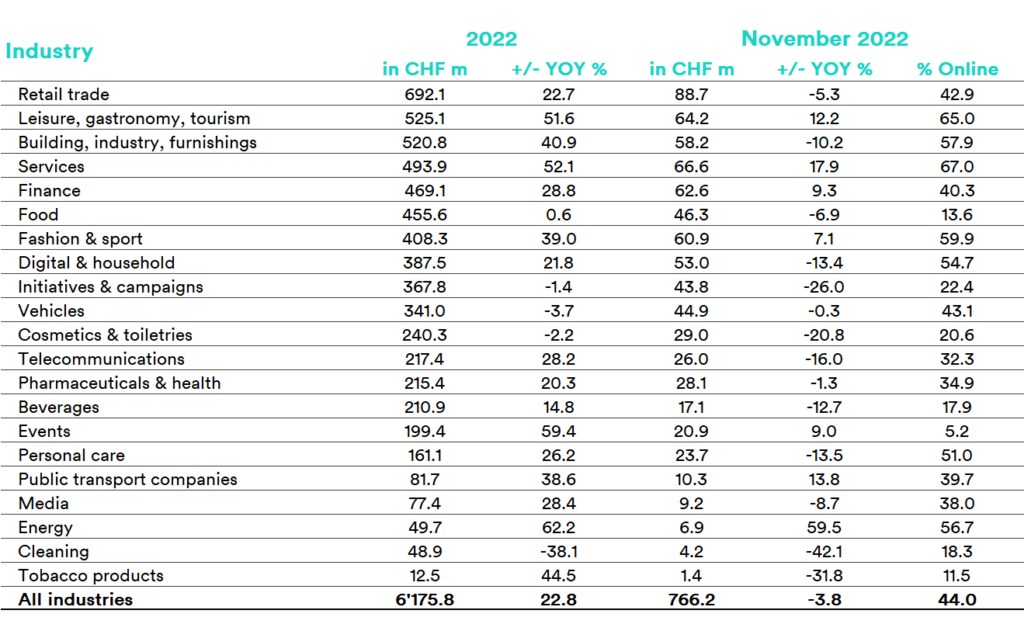
It was the energy sector which recorded the largest percentage increase in comparison to the previous year – both in November (+59.5%) and YTD (+62.2%) – an exceptionally remarkable result, considering that the industry had already experienced a nearly 100% increase in advertising pressure in November 2021 (+94.5%). Other industries, too, are upping the ante: services (+17.9%); transportation (+13.8%); leisure, gastronomy and tourism (+12.2%); finance (+9.3%); events (+9.0%); and fashion and sports (+7.1%).
14 out of 21 sectors down in November
Yet for a majority of industries, advertising pressure dropped in November. When compared to the previous year, 14 out of 21 industries recorded losses, particularly cleaning (-42.1%), tobacco products (-31.8%), initiatives and campaigns (-26.0%) and cosmetics and toiletries (-20.8%).
After 11 months to date, the trajectory for 17 of the 21 industries is recovering. Only the cleaning sector is experiencing a distinct weakening in advertising pressure of -38.1%. The automotive sector (-3.7%), cosmetics and toiletries (-2.2%) and initiatives and campaigns (-1.4%) are only recording slight losses.
Top of the month
The top advertisers and most widely advertised products and services (excluding range, image and collective categories) in November
With Total Brand Visibility, Media Focus offers a product that compiles data about your media presence from advertising and reporting and then analyzes this.
Media Focus assists you by recording data about the advertising presence of your competitors and industry and analyzing advertising volume and campaign and brand strategies.
Media Focus offers every service you need for efficient media monitoring, helping you to keep track of everything and showing you how successful your communications activities have been.
We use technologies such as cookies to store and/or access device information. We do this to improve the browsing experience and to display (non) personalised advertising. If you do not consent or withdraw consent, this may affect certain features and functionality.
Functional
Always active
Technical storage or access is strictly necessary for the lawful purpose of enabling the use of a particular service specifically requested by the subscriber or user, or for the sole purpose of carrying out the transmission of a message over an electronic communications network.
Vorlieben
Die technische Speicherung oder der Zugriff ist für den rechtmäßigen Zweck der Speicherung von Präferenzen erforderlich, die nicht vom Abonnenten oder Benutzer angefordert wurden.
Statistics
The technical storage or access used solely for anonymous statistical purposes. Absent a subpoena, the voluntary consent of your Internet service provider, or additional third-party records, information stored or accessed for this purpose alone generally cannot be used to identify you.Die technische Speicherung oder der Zugriff, der ausschließlich zu anonymen statistischen Zwecken verwendet wird. Ohne eine Vorladung, die freiwillige Zustimmung deines Internetdienstanbieters oder zusätzliche Aufzeichnungen von Dritten können die zu diesem Zweck gespeicherten oder abgerufenen Informationen allein in der Regel nicht dazu verwendet werden, dich zu identifizieren.
Marketing
Technical storage or access is necessary to create user profiles, to send advertisements, or to track users on a website or across websites for similar marketing purposes.